Summer Sale - Special 70% Discount Offer - Ends in 0d 00h 00m 00s - Coupon code: 70dumps

Applied-Probability-and-Statistics Questions and Answers

Question # 6

Sample mean = 40, SD = 8, n = 16. Standard error = ?

A.

2

B.

8

C.

0.5

D.

4

Full Access
Question # 7

Histogram is best for:

A.

Continuous numerical data frequency

B.

Categorical data

C.

Scatterplots

D.

Boxplots

Full Access
Question # 8

A home inspector finds 3% of the homes in a community infected with termites.

How should the home inspector’s findings be interpreted?

A.

It is impossible that a home in the community is infected with termites.

B.

It is likely that a home in the community is infected with termites.

C.

It is unlikely that a home in the community is infected with termites.

D.

It is as likely as unlikely that a home in the community is infected with termites.

Full Access
Question # 9

A class of 25 students includes 10 who play soccer, 8 who play basketball, and 7 who play neither sport.

What is the probability of randomly selecting a student who does not play soccer?

A.

.30

B.

.40

C.

.50

D.

.60

Full Access
Question # 10

In a class of 30 students, 18 are enrolled in a math course, and 12 are enrolled in a science course. Among the students enrolled in the science course, 8 are also enrolled in the math course.

What is the probability that a student is enrolled in the math course given that they are enrolled in the science course?

A.

.27

B.

.40

C.

.44

D.

.67

Full Access
Question # 11

What is the result of 2/5 + 1/3 − 1/4?

A.

13/60

B.

11/60

C.

29/60

D.

19/60

Full Access
Question # 12

Sample correlation r = 0 →

A.

No linear relationship

B.

Strong positive

C.

Strong negative

D.

Perfect correlation

Full Access
Question # 13

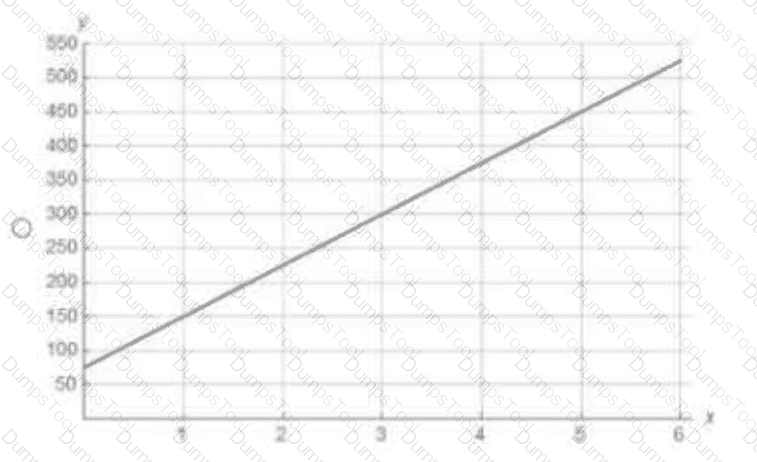
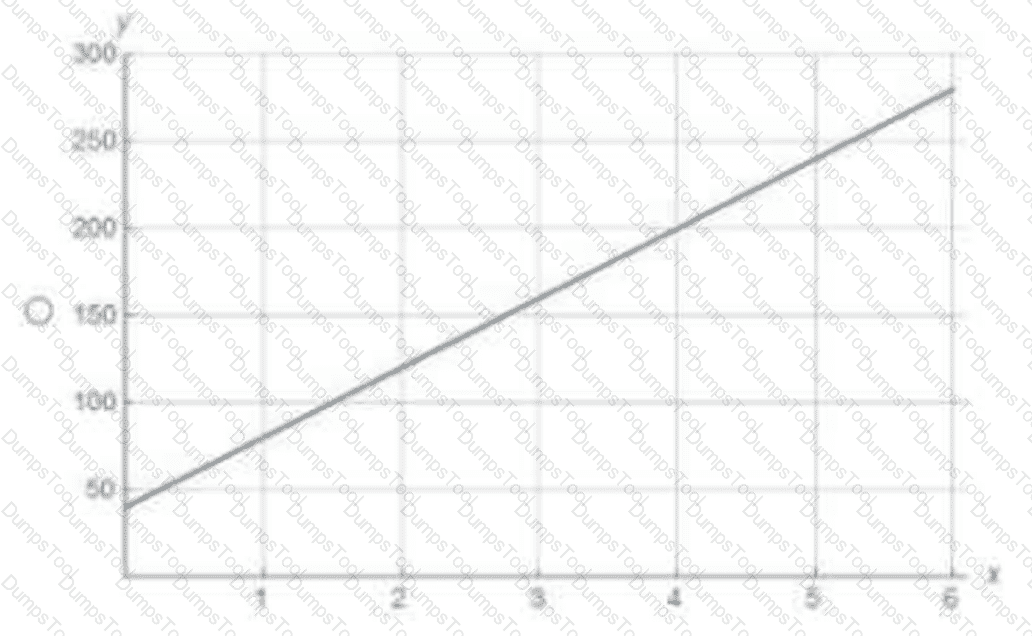
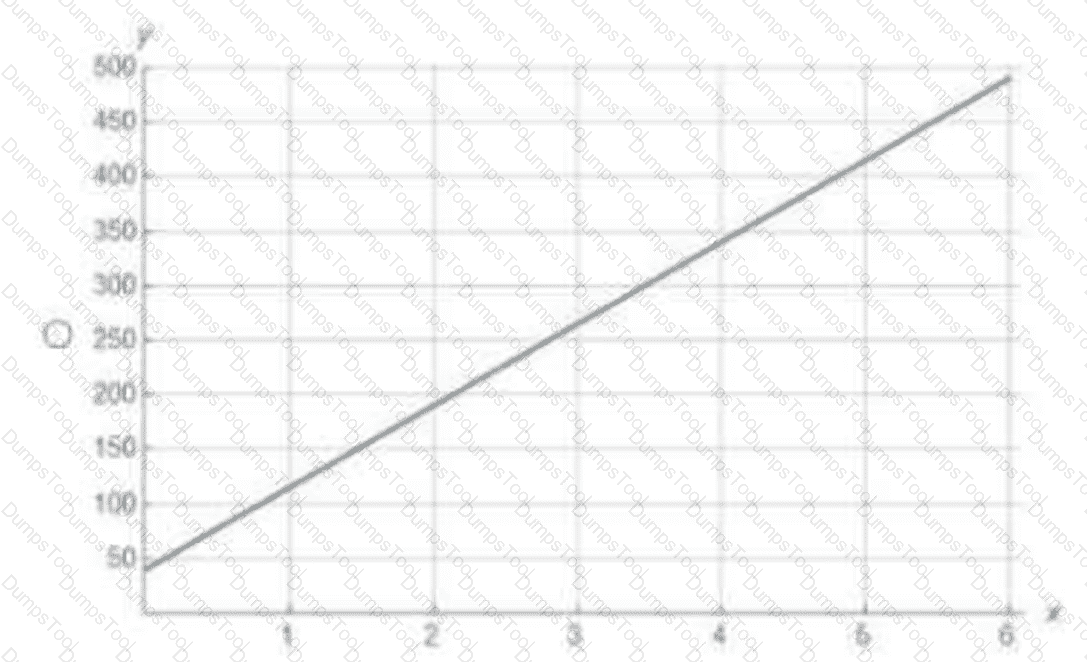
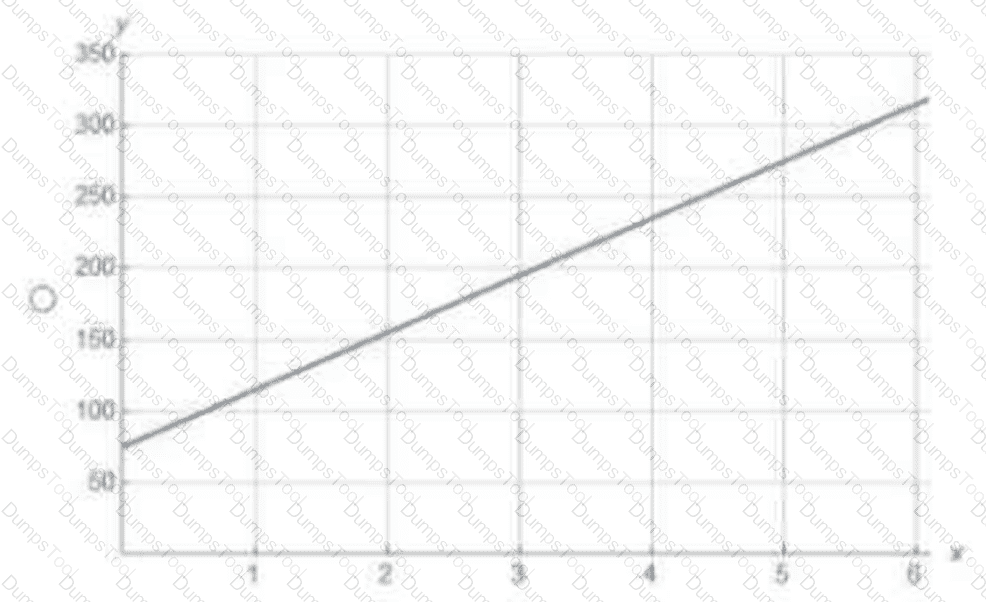
A recording studio raises its use fee to $75 and charges $40 per hour for studio time. The equation of the total cost of a recording session as a function of studio time is y = 40x + 75.

Which graph represents this equation?

Question # 13

Question # 13

Question # 13

Question # 13

A.

Graph 1

B.

Graph 2

C.

Graph 3

D.

Graph 4

Full Access
Question # 14

A spinner is divided into four equal sections labeled A, B, C, and D.

What is the sample space for this experiment?

A.

{A, B, C, D, E}

B.

{AB, CD}

C.

{1, 2, 3, 4}

D.

{A, B, C, D}

Full Access
Question # 15

Poisson used for:

A.

Rare events per interval

B.

Success/failure trials

C.

Continuous data

D.

Categorical data

Full Access
Question # 16

A sample of 100 houses was surveyed in each of two states: Georgia and Kansas. Square footages of the houses are summarized by state in the following side-by-side box plots.

Question # 16

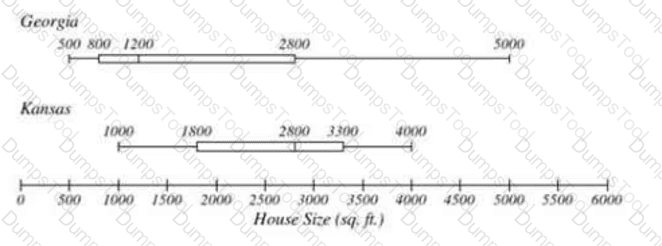
What is the interquartile range for house sizes in Georgia?

A.

1500 sq ft

B.

2000 sq ft

C.

3000 sq ft

D.

4500 sq ft

Full Access
Question # 17

A sociologist is investigating the relationship between educational level, high school, bachelor’s, master’s, and doctorate, and annual income.

How should this study be classified?

A.

Categorical→quantitative

B.

Categorical→categorical

C.

Quantitative→categorical

D.

Quantitative→quantitative

Full Access
Question # 18

Z-test used when:

A.

Population σ known

B.

σ unknown

C.

Sample small

D.

Population categorical

Full Access
Question # 19

Sample correlation r = 0.6. R² = ?

A.

0.36

B.

0.6

C.

0.16

D.

1

Full Access
Question # 20

68-95-99.7 rule: % within 1 SD?

A.

68%

B.

95%

C.

99%

D.

50%

Full Access
Question # 21

A school surveyed student participation in extracurricular activities. The survey found:

    The drama club had 50% of students participate.

    The science club had 30% of students participate.

    Both clubs had 15% of students participate.

What is the probability that a student participated in the drama club, given that they attended the science club?

A.

.15

B.

.3

C.

.40

D.

.5

Full Access
Question # 22

Boxplot shows:

A.

Median, quartiles, outliers

B.

Frequency counts

C.

Scatterplots

D.

Probability

Full Access
Question # 23

Histogram vs bar chart:

A.

Histogram for numeric intervals, bar for categories

B.

Bar for numeric, histogram for categories

C.

Same

D.

None

Full Access
Question # 24

Probability of drawing king or queen from deck = ?

A.

8/52

B.

4/52

C.

1/13

D.

1/26

Full Access
Question # 25

Poisson mean = 4. Probability of exactly 2 events?

A.

(e^-4 × 4²)/2! = 0.1465

B.

0.2

C.

0.5

D.

0.25

Full Access
Question # 26

Probability of exactly 1 head in 2 coin flips = ?

A.

1/2

B.

1/4

C.

3/4

D.

1

Full Access
Question # 27

Type II error = ?

A.

Accept H₀ when false

B.

Reject H₀ when true

C.

Correct decision

D.

None

Full Access
Question # 28

Probability of rolling an even number on a six-sided die?

A.

1/3

B.

1/2

C.

1/6

D.

2/3

Full Access
Question # 29

Correlation coefficient = −0.7. This indicates:

A.

Strong negative linear relationship

B.

Strong positive

C.

No relationship

D.

Weak positive

Full Access
Question # 30

In hypothesis testing, rejecting H₀ when true = ?

A.

Type I error

B.

Type II error

C.

Correct decision

D.

Null accepted

Full Access
Question # 31

Confidence interval = sample mean ± ?

A.

Critical value × SE

B.

Variance × n

C.

SD only

D.

Median

Full Access
Question # 32

Standard deviation measures:

A.

Spread of data

B.

Central tendency

C.

Probability

D.

Frequency

Full Access
Question # 33

The table shows the results of a survey of favorite movie genres.

Question # 33

What is the probability of selecting an action and then a comedy respondent if the selection is replaced?

A.

10.5%

B.

12.5%

C.

68%

D.

75%

Full Access
Question # 34

Random variable X = number of heads in 4 coin flips →

A.

Discrete

B.

Continuous

C.

Neither discrete nor continuous

D.

Both discrete and continuous

Full Access
Question # 35

What is the mode of this dataset: 3, 5, 7, 7, 10?

A.

The mode is 10.

B.

The mode is 5.

C.

The mode is 7.

D.

The mode is 3.

Full Access
Question # 36

Determine z in the equation:

1/(6z) = 2/9

A.

9/12

B.

2/54

C.

12/9

D.

18/2

Full Access
Question # 37

Binomial expected value = ?

A.

n × p

B.

n/p

C.

p/n

D.

n + p

Full Access
Question # 38

Empirical probability is based on:

A.

Observed frequency of events

B.

Classical calculation

C.

Subjective guess

D.

Theoretical models

Full Access
Question # 39

A dataset: 4, 8, 12, 16, 20. Mean = ?

A.

10

B.

12

C.

14

D.

16

Full Access
Question # 40

Which graph displays data in a manner that is accurate?

Question # 40

Question # 40

Question # 40

Question # 40

A.

Bar graph titled “Number of Miles Traveled,” with the vertical axis labeled in feet.

B.

Bar graph titled “Number of Feet Traveled,” with the vertical axis labeled “Number of Feet” and the horizontal axis labeled “Student Travelers.”

C.

Pie chart titled “Distance Traveled.”

D.

Line graph titled “Number of Feet Traveled.”

Full Access
Question # 41

A t-distribution is used when:

A.

σ unknown, small sample

B.

σ known, large sample

C.

Population categorical

D.

Data continuous

Full Access
Question # 42

Two dice rolled, probability of both even = ?

A.

1/4

B.

1/2

C.

1/3

D.

1/6

Full Access
Question # 43

Expected value of X = 1×0.2 + 2×0.5 + 3×0.3 = ?

A.

2.1

B.

2.0

C.

1.5

D.

3.0

Full Access
Question # 44

Two mutually exclusive events: P(A and B) = ?

A.

0

B.

P(A) × P(B)

C.

P(A) + P(B)

D.

1

Full Access
Question # 45

Correlation coefficient r = −0.9 indicates:

A.

Strong negative linear relationship

B.

Strong positive

C.

Weak negative

D.

No relationship

Full Access
Question # 46

A dataset: 2, 4, 6, 8, 10. Variance = ?

A.

10

B.

8

C.

6.25

D.

5

Full Access