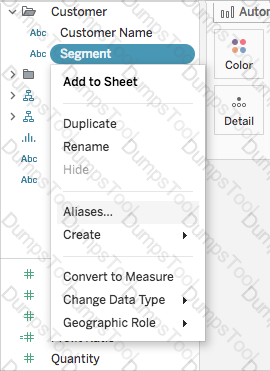
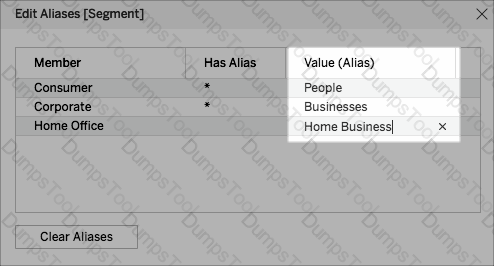
You can create _______________ for members in a dimension so that their labels appear differently in the view.
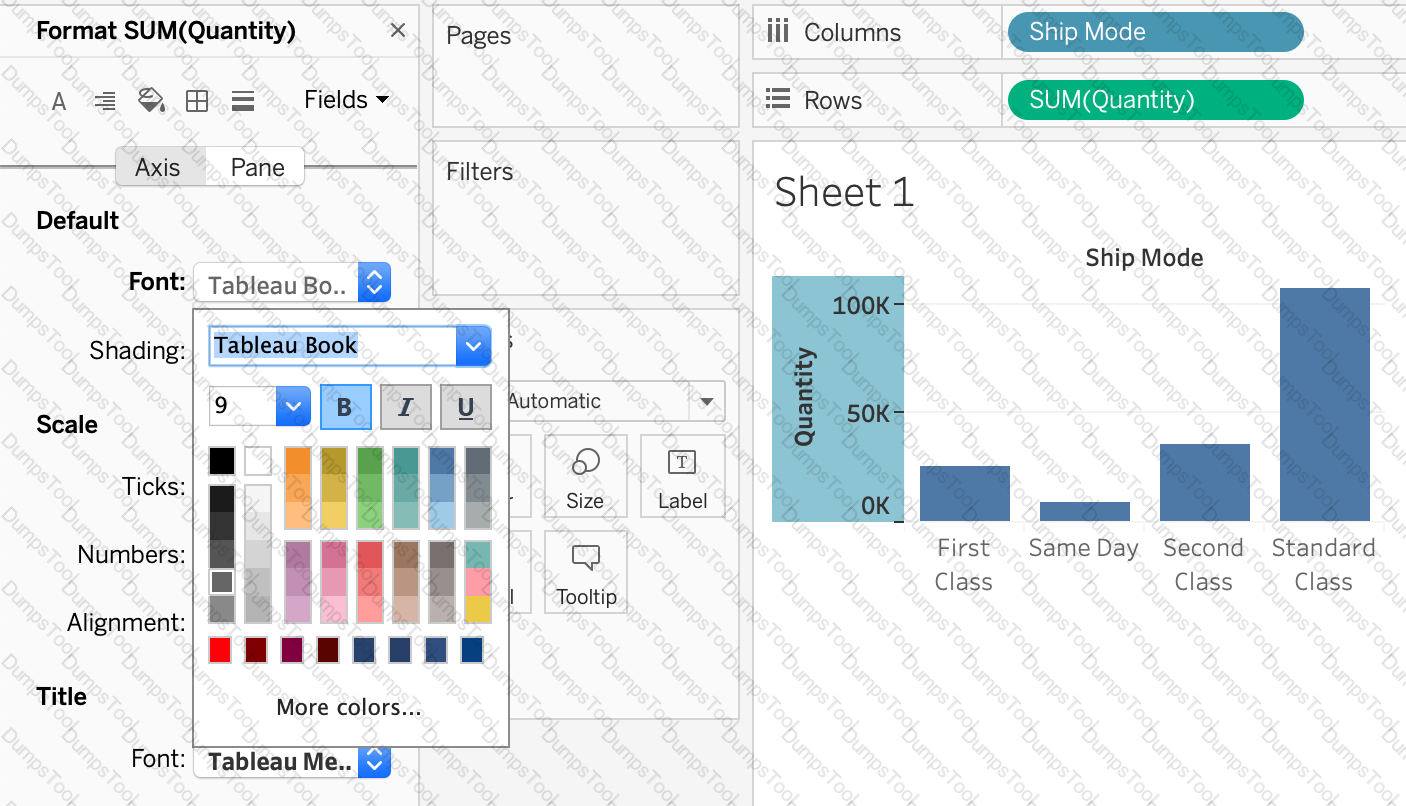
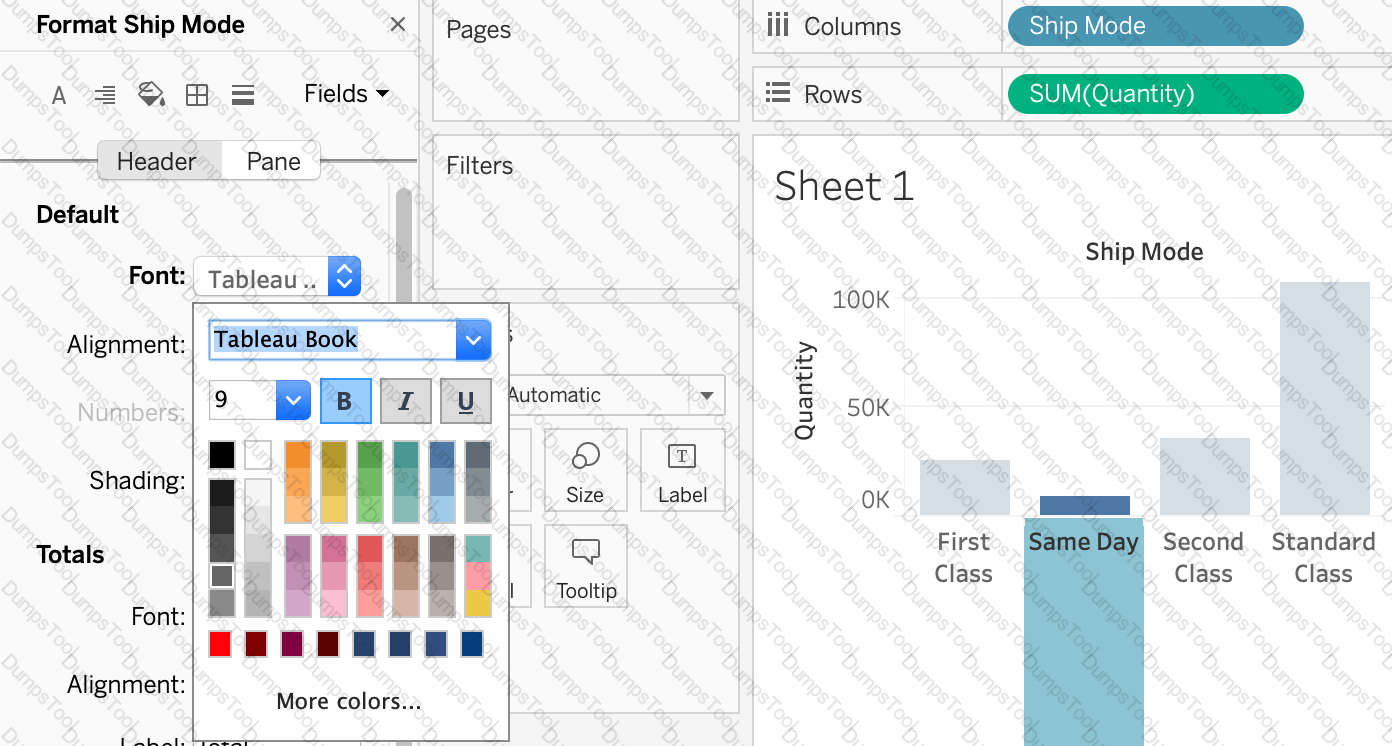
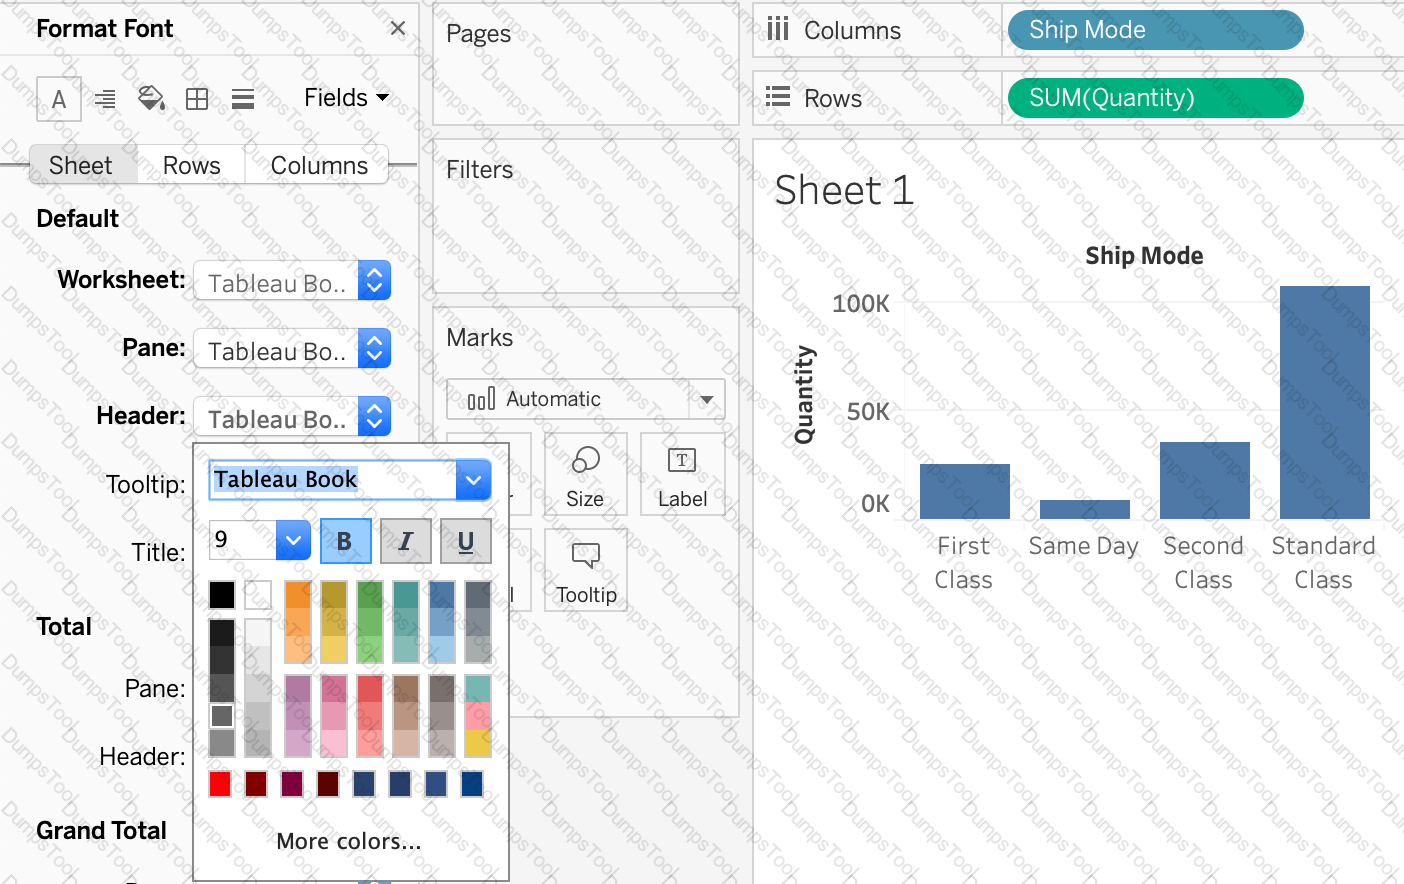
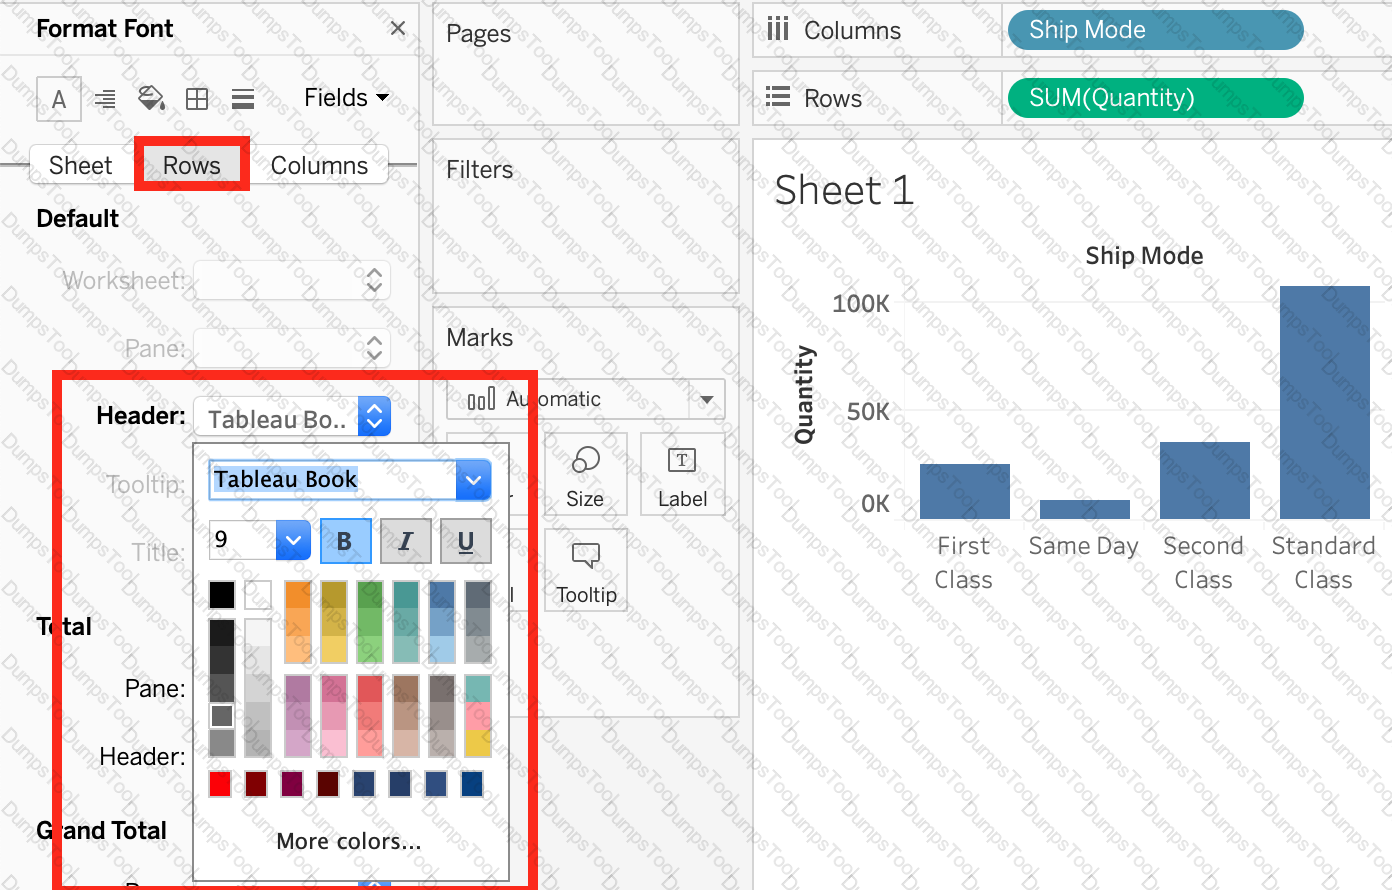
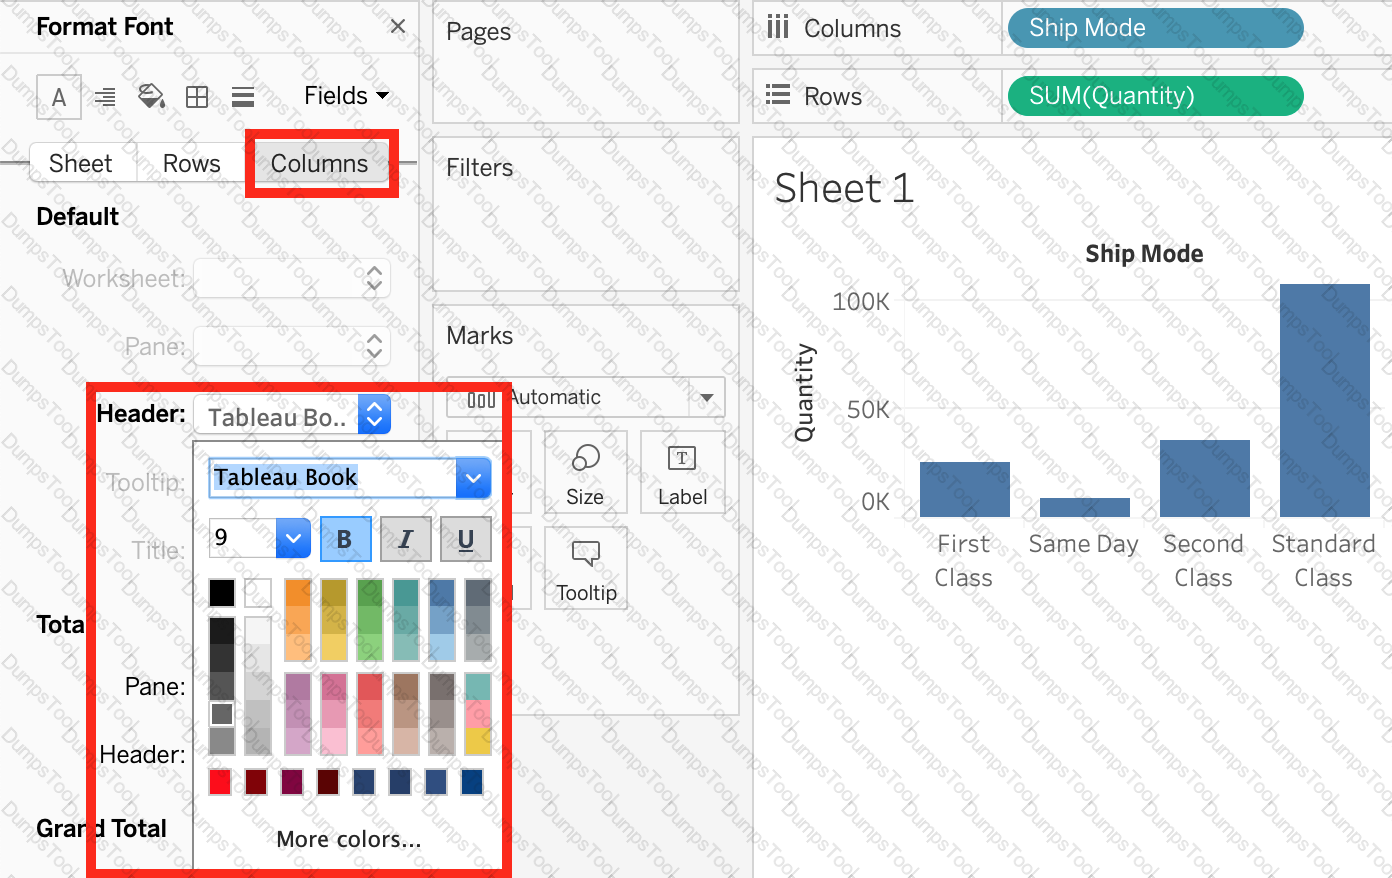
Which of the following are valid way(s) to make either of Rows or Columns Bold without affecting the other?
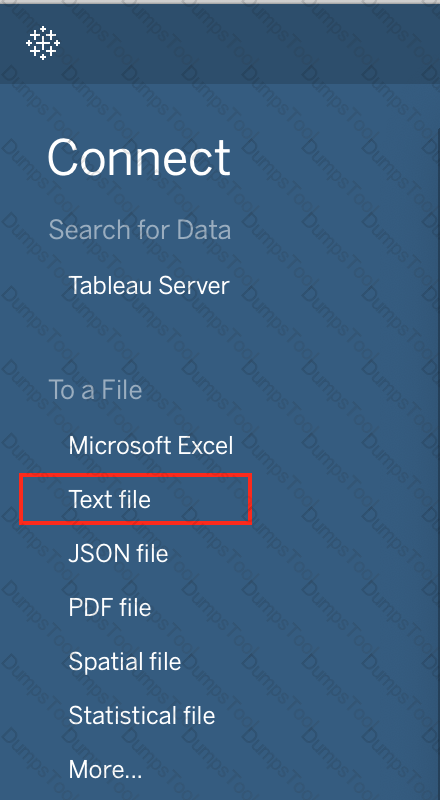
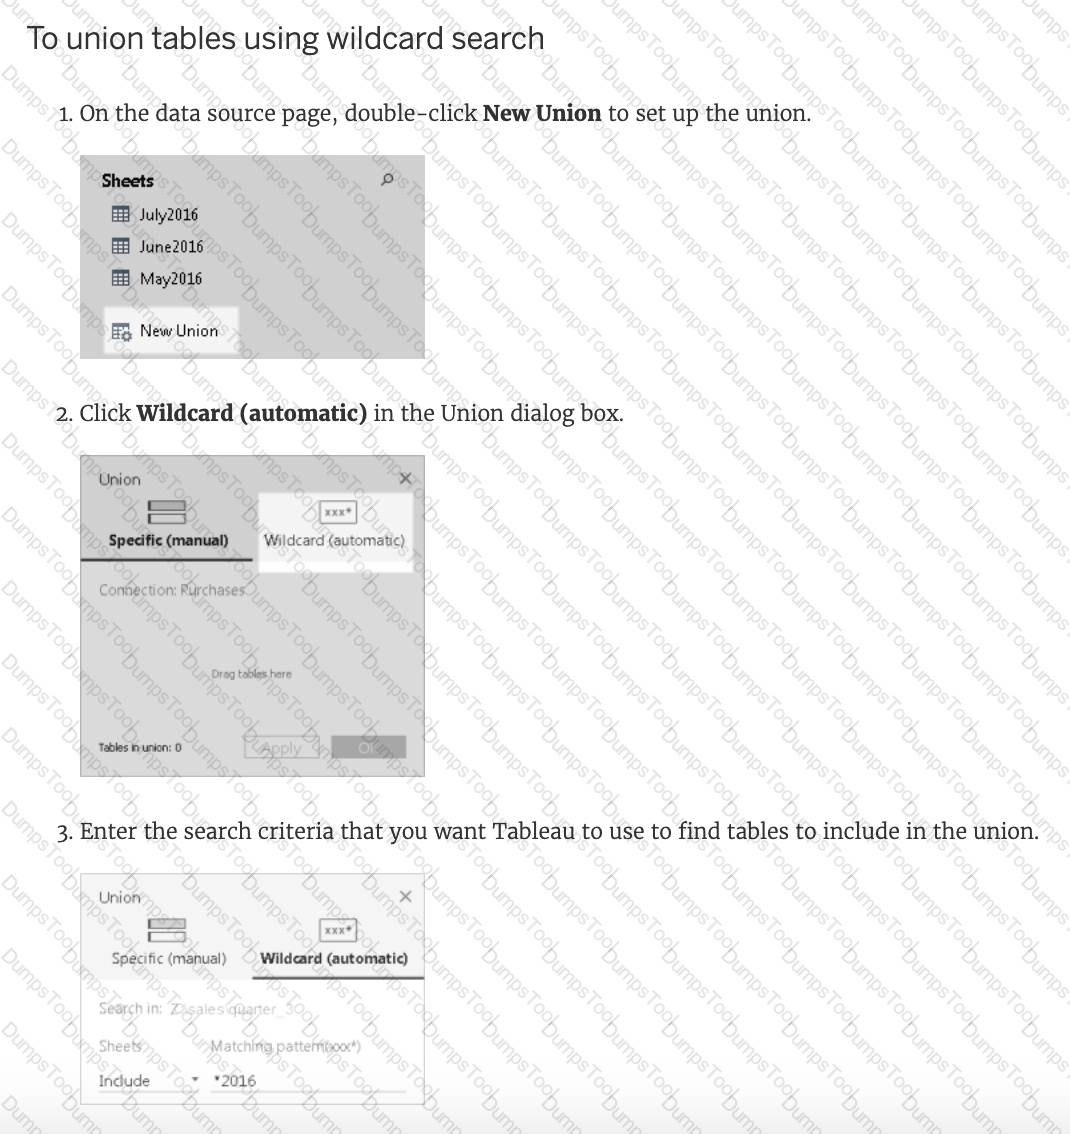
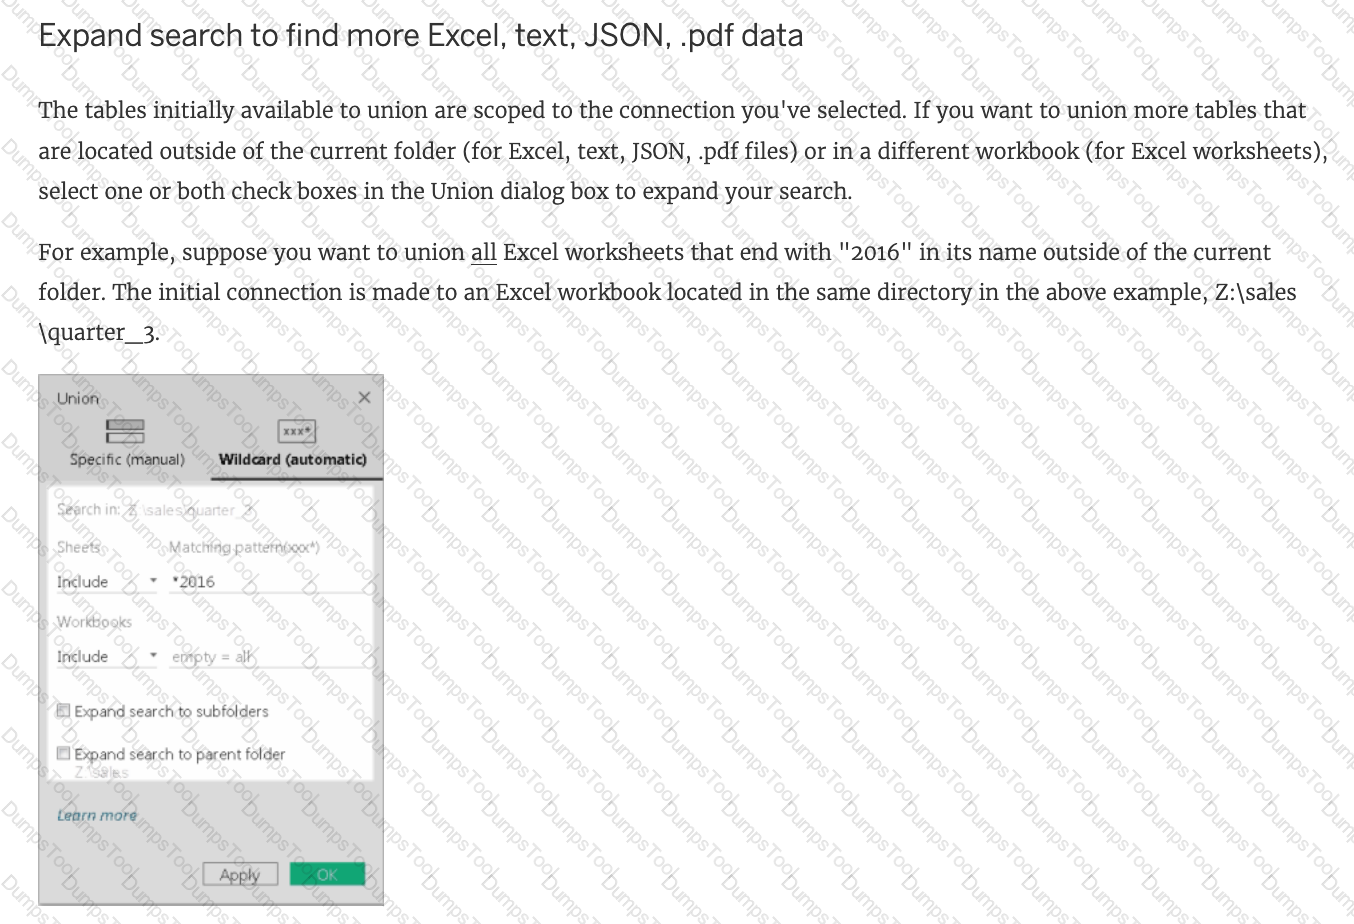
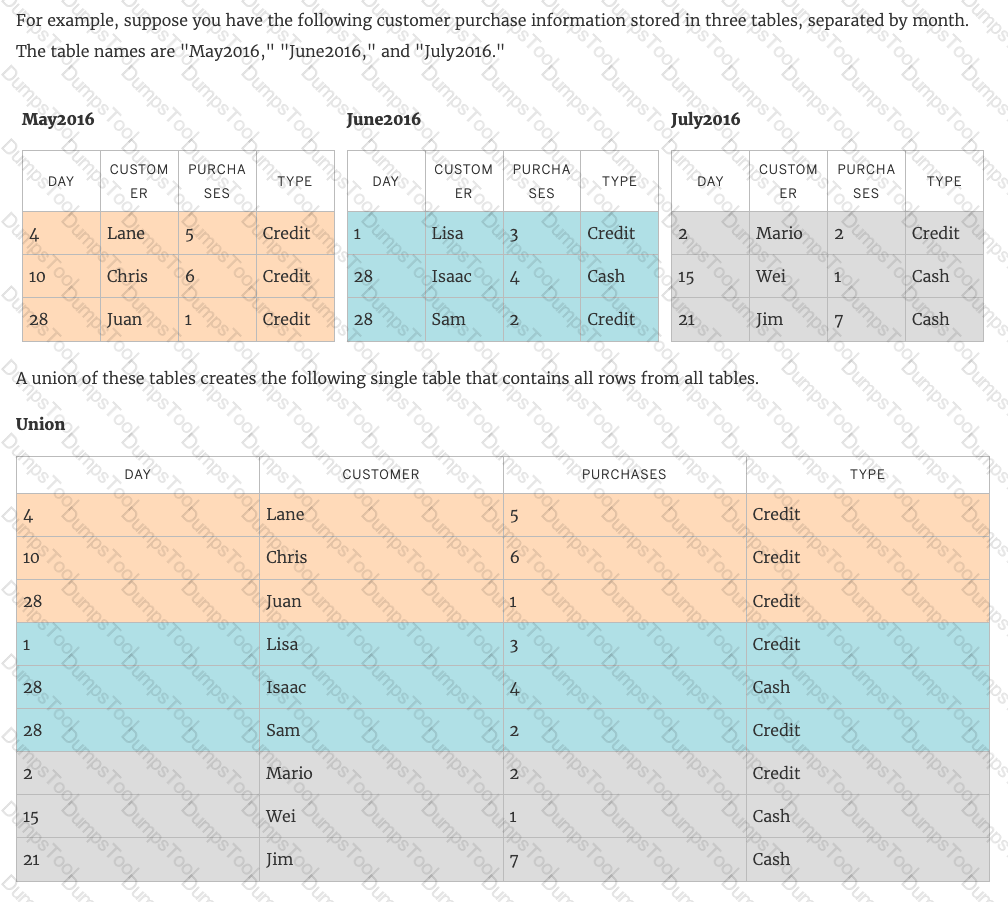
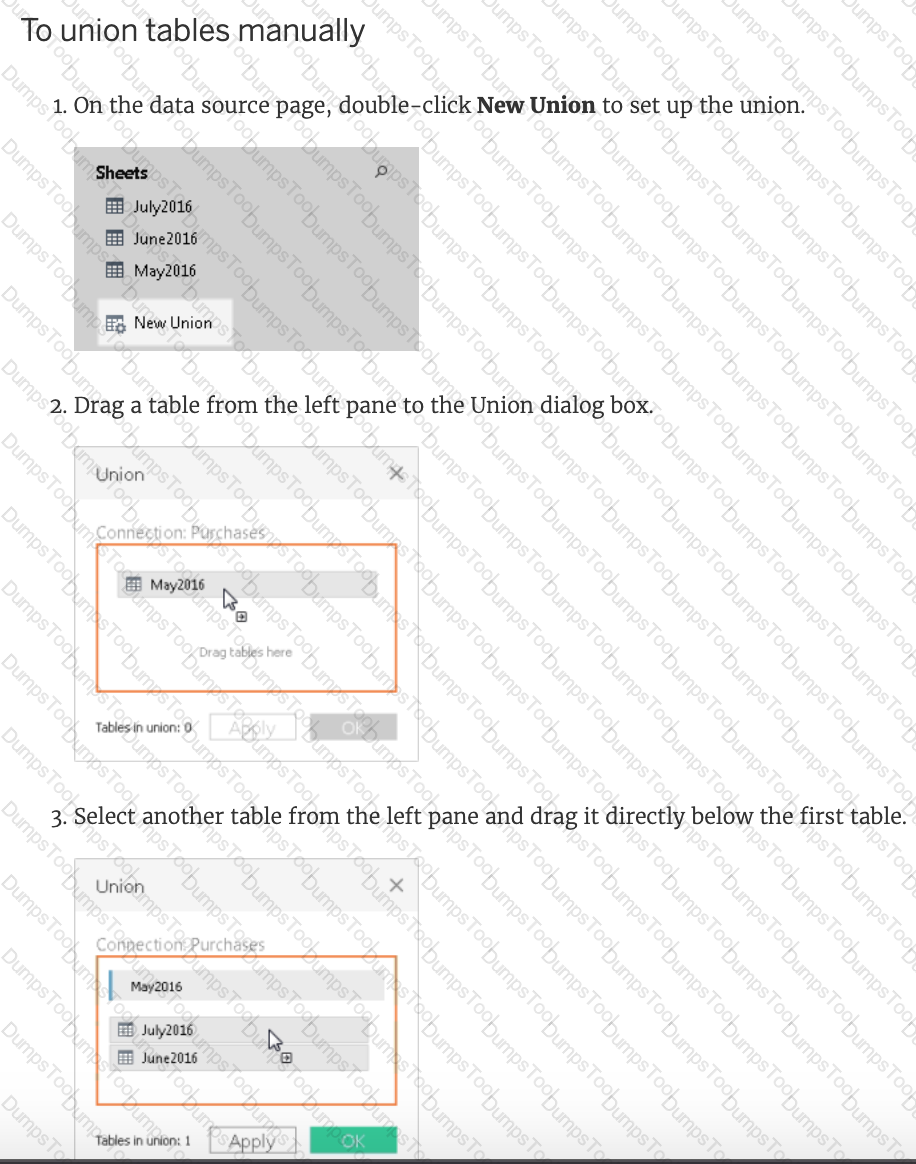
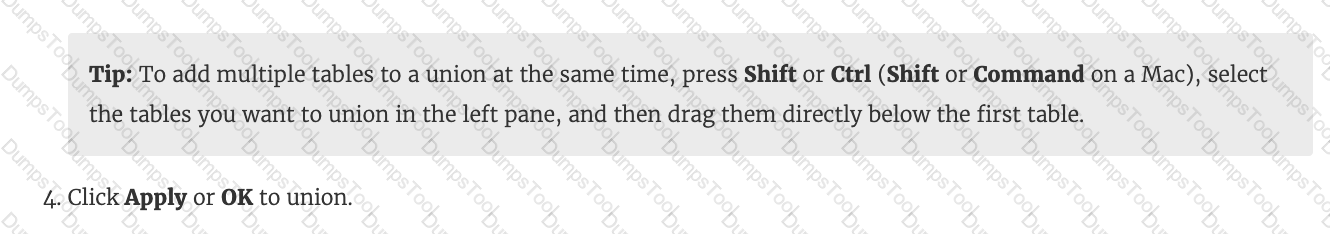
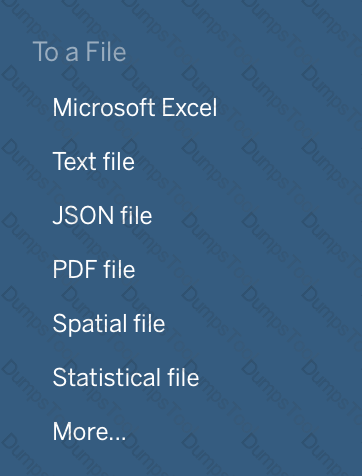
When working with Excel, text file data, JSON file, .pdf file data, you can use _________________ to union files across folders, and worksheets across workbooks. Search is scoped to the selected connection.
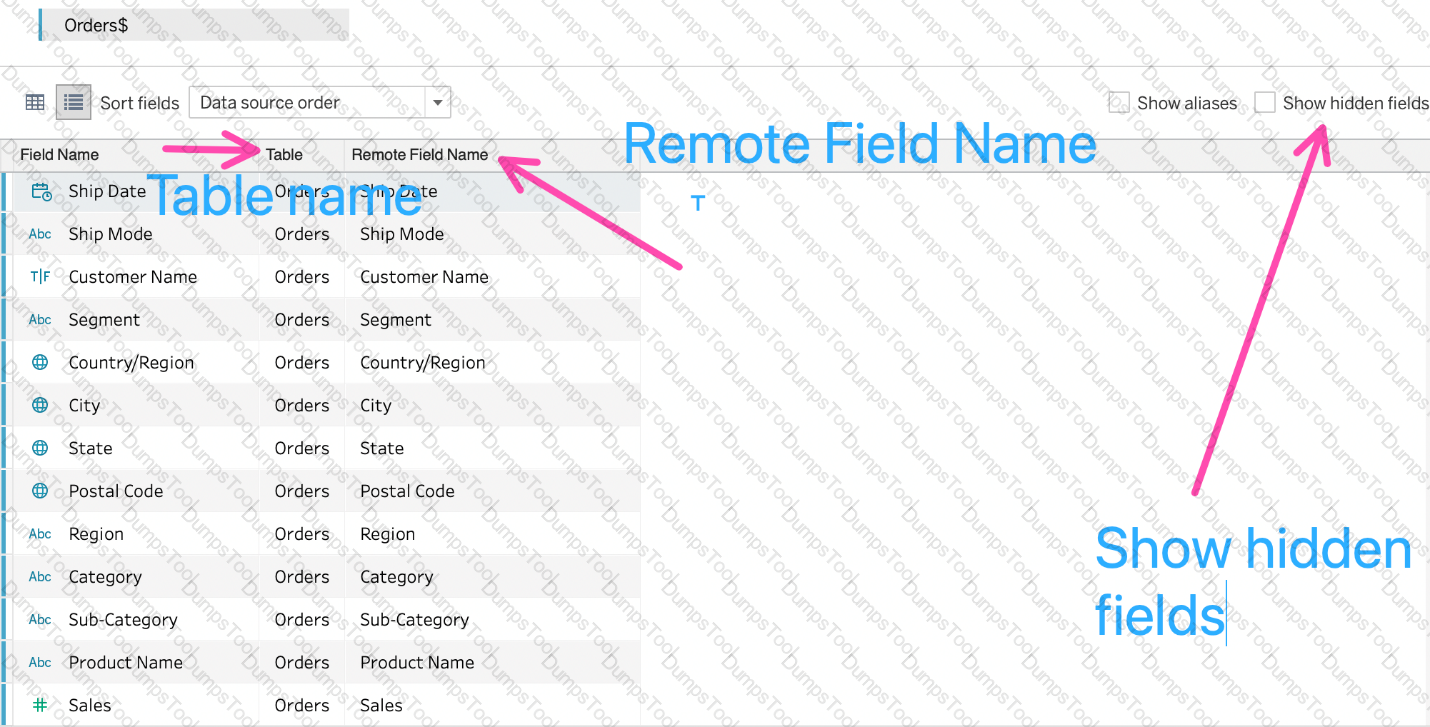
Which of the following are valid use-cases for the 'Manage Metadata' functionality?
Which of the following is a compelling reason to export a sheet in Tableau to a PDF?
You need to access options to change a dimension's color palette.
In addition to the Marks card, what else can you use?
You have a visualization that uses multiple types of sorting.
How can you clear all sorting of the visualization?
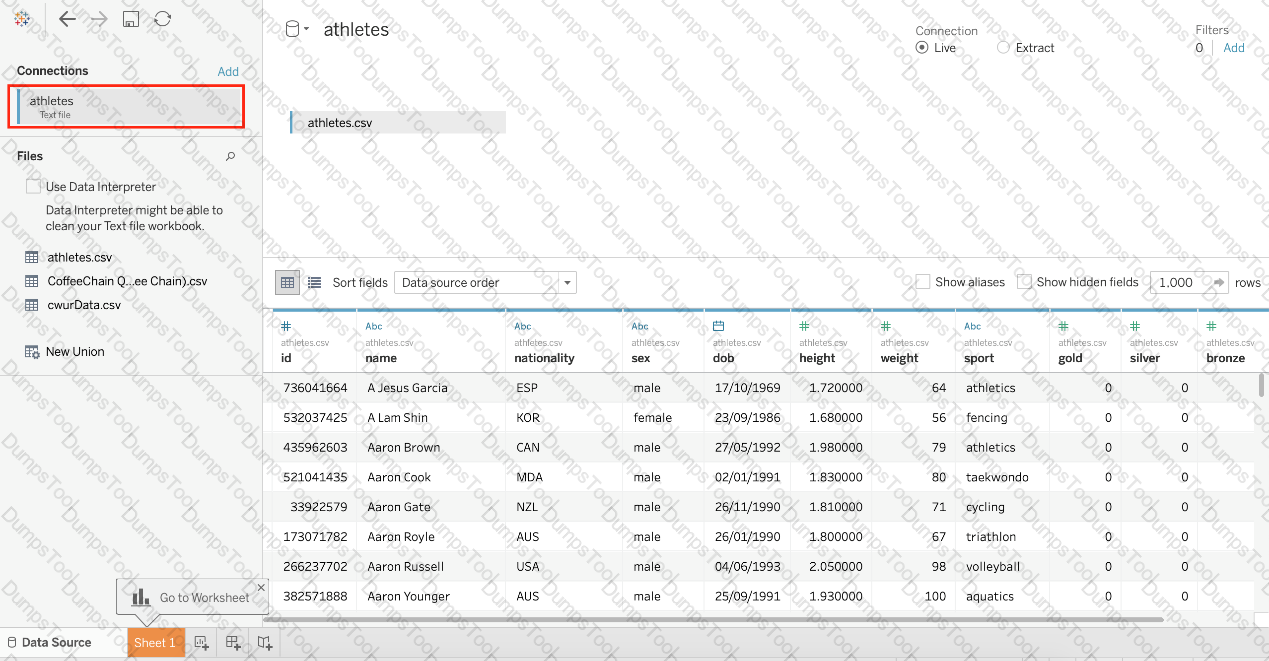
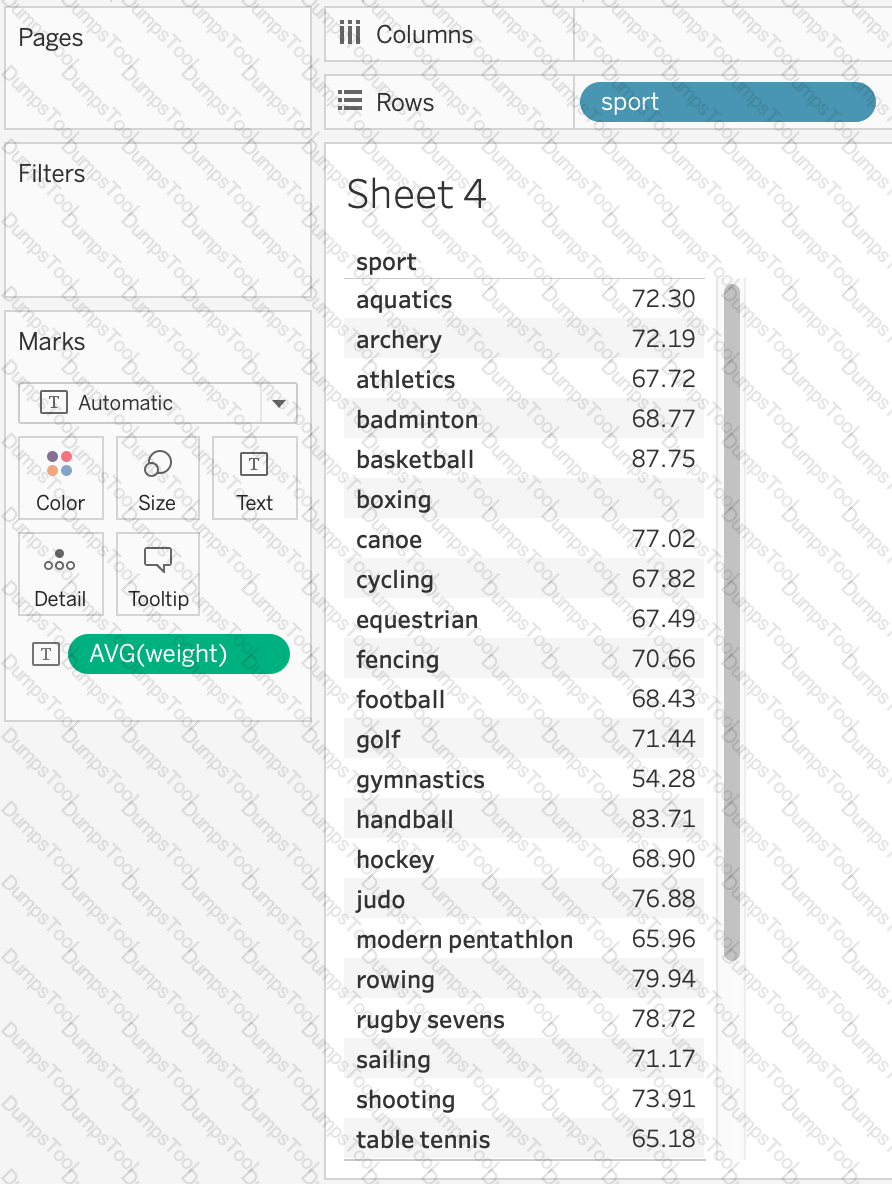
Using the atheletes table:
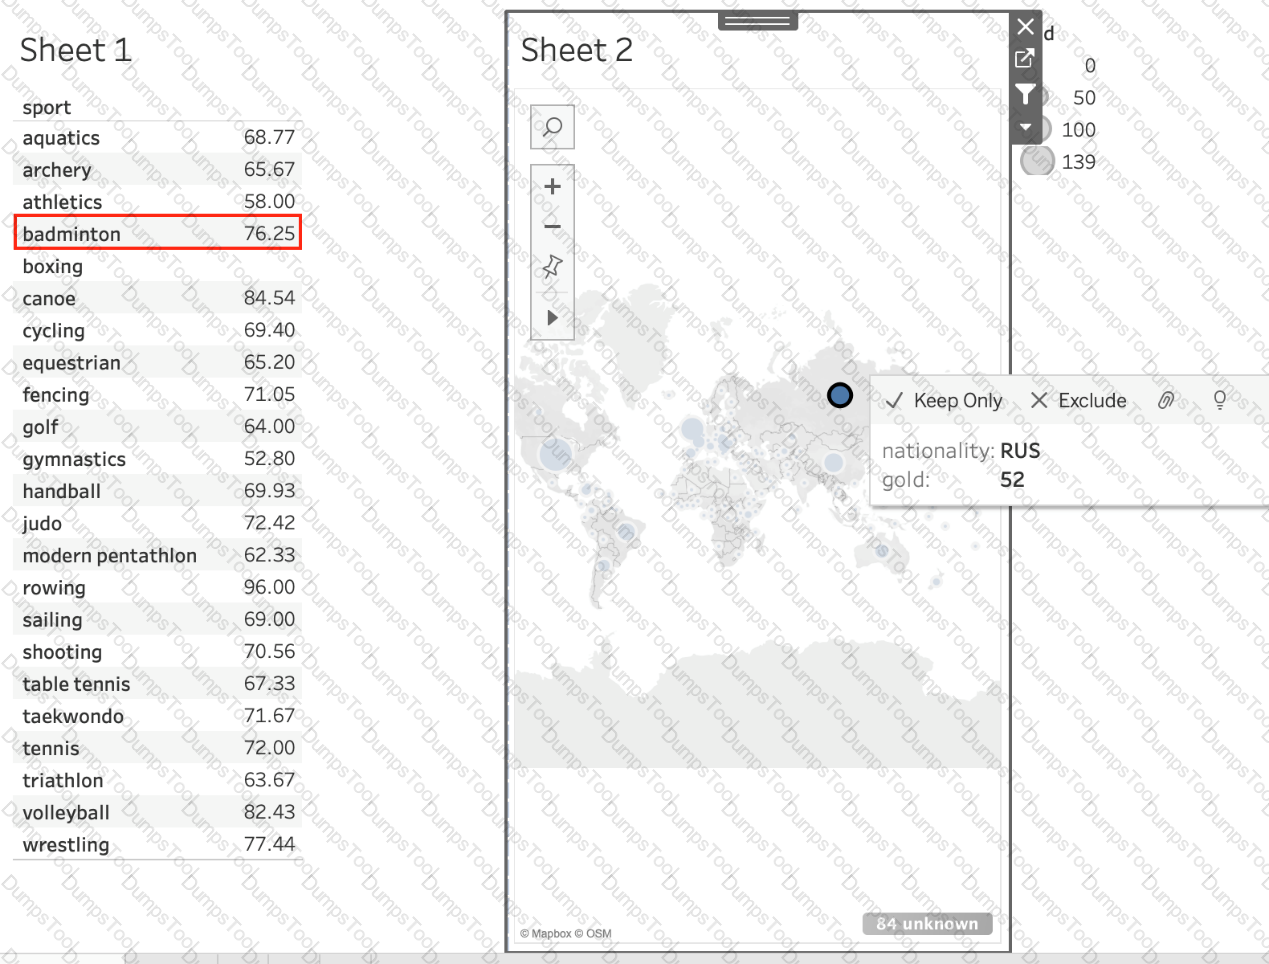
i) Create a sheet with a crosstab showing the Average weight for each sport (Sheet 1)
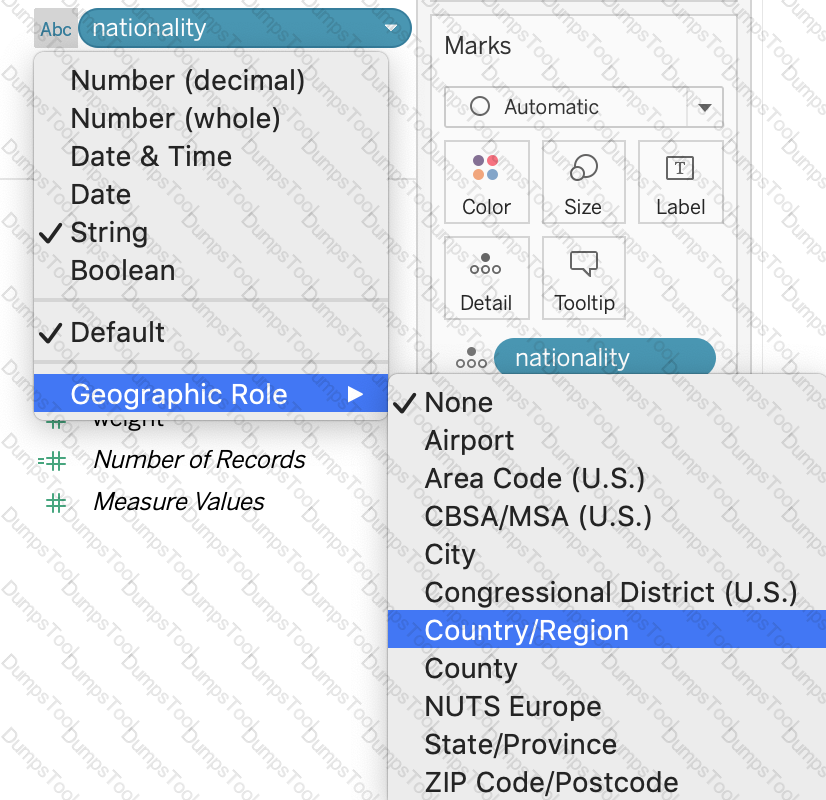
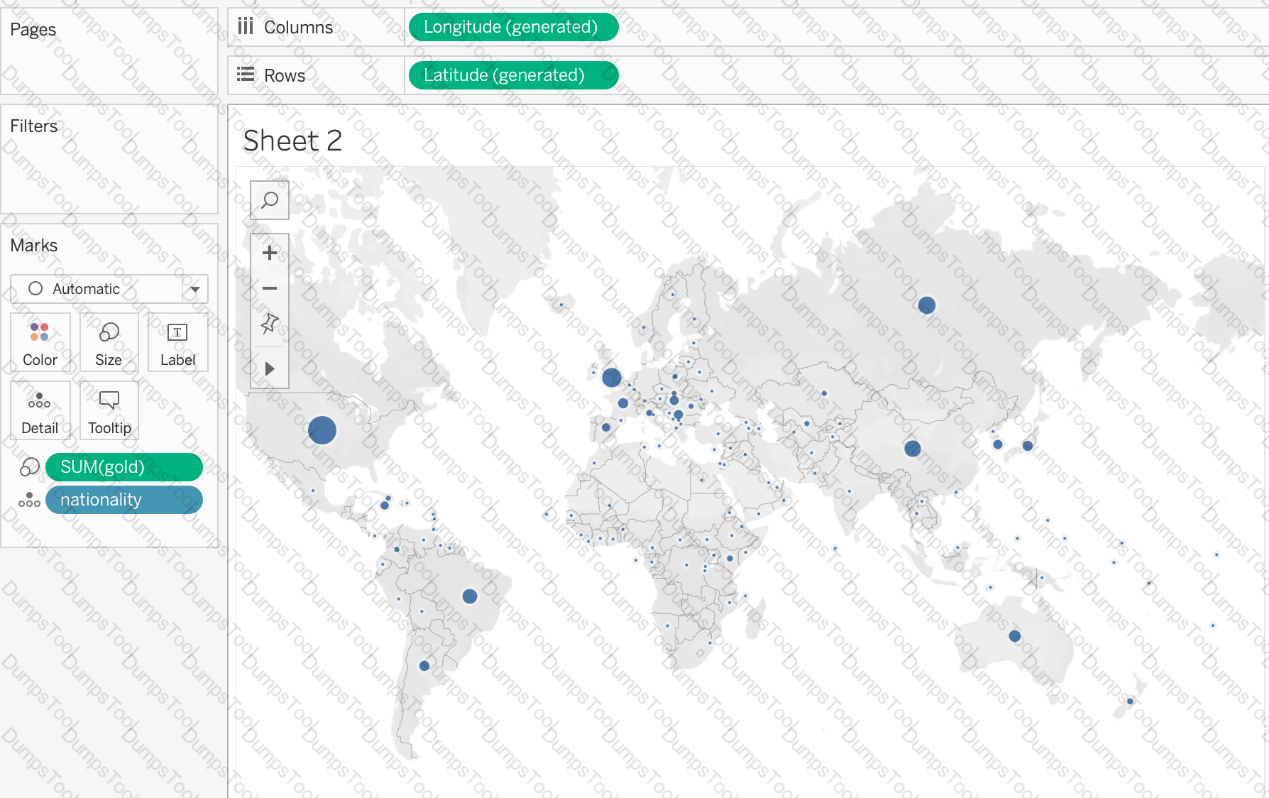
ii) Create a sheet with a Map showing the Total number of gold medals per Country. Use size as a Mark. (Sheet 2)
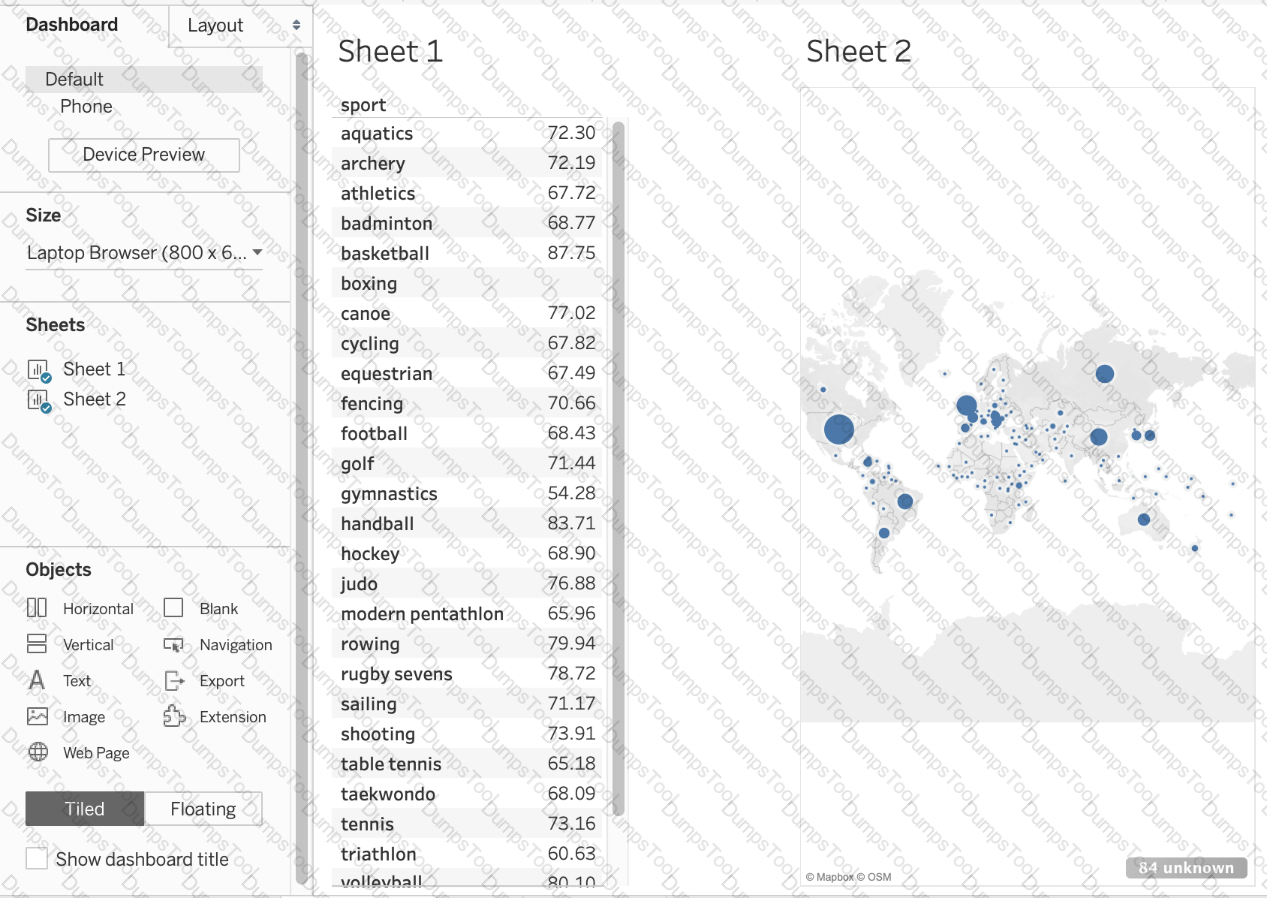
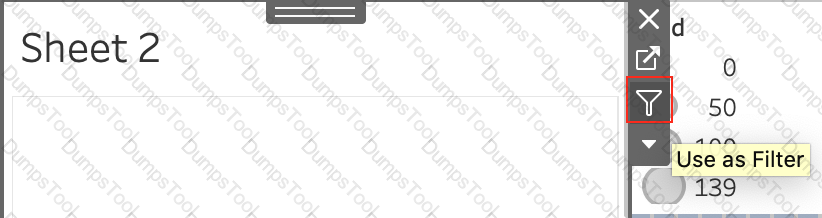
Now, Create a Dashboard containing both these sheets, and Use Sheet 2 as a Filter for Sheet 1. What was the average weight for Badminton in Russia?
(Ignore any nulls / unknowns)
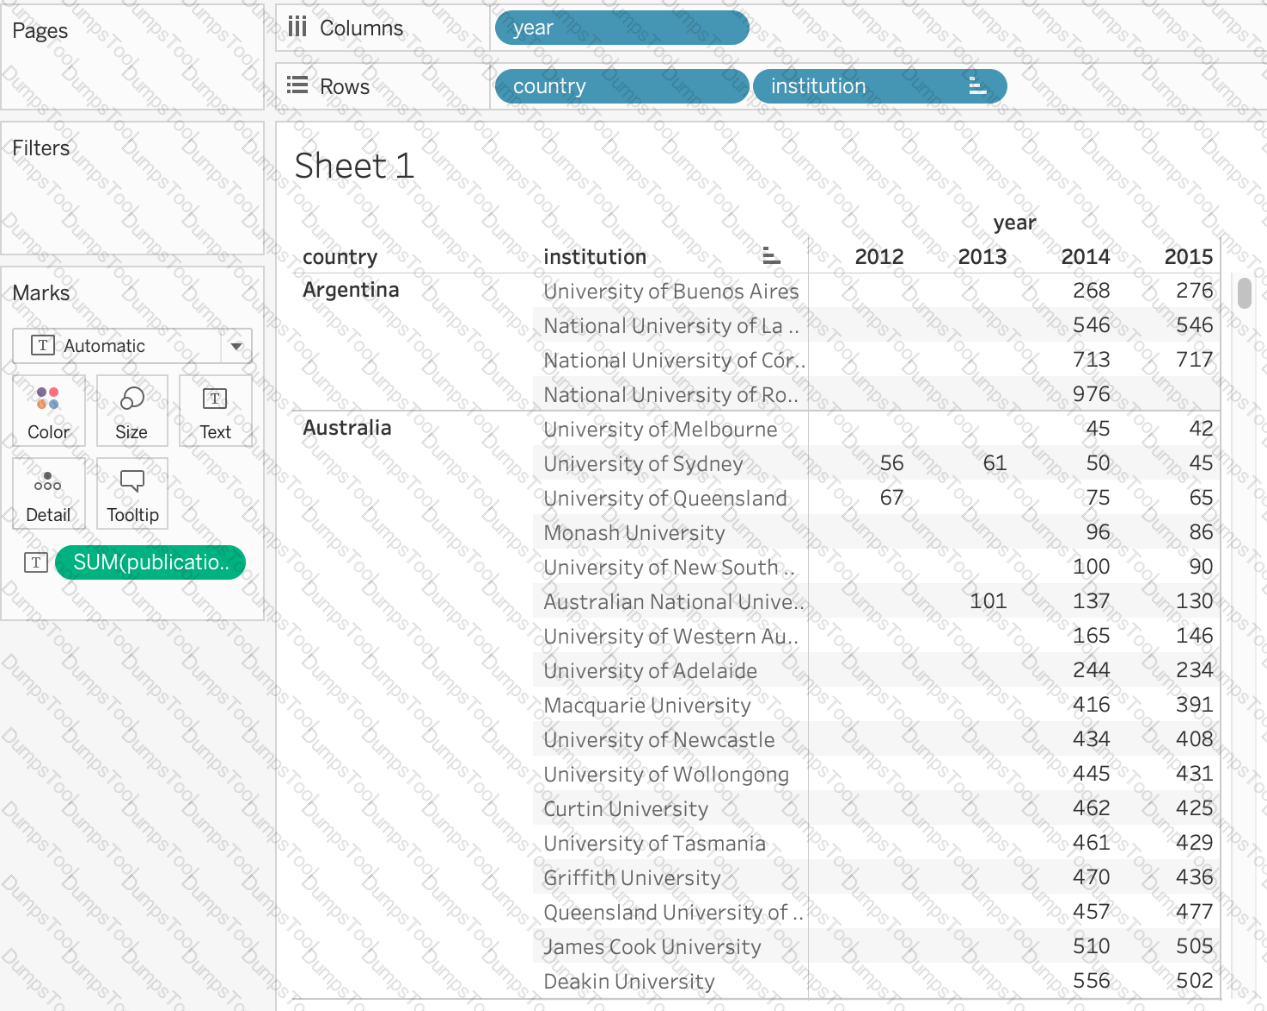
Using the cwurData table, create a cross-tab showing the number of Publications per Country broken down by Institution, and filtered by Country to only show United Kingdown (UK). For the University of Manchester, what percent of the total publications were contributed in 2014?
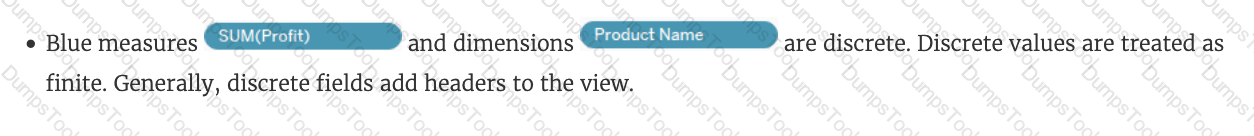
You have a continuous numeric measure named Sales.
Which chart type is created when you double-click the Sales measure?
Given a map, which of the following fields can be placed in Size,Shape,Detail,Color
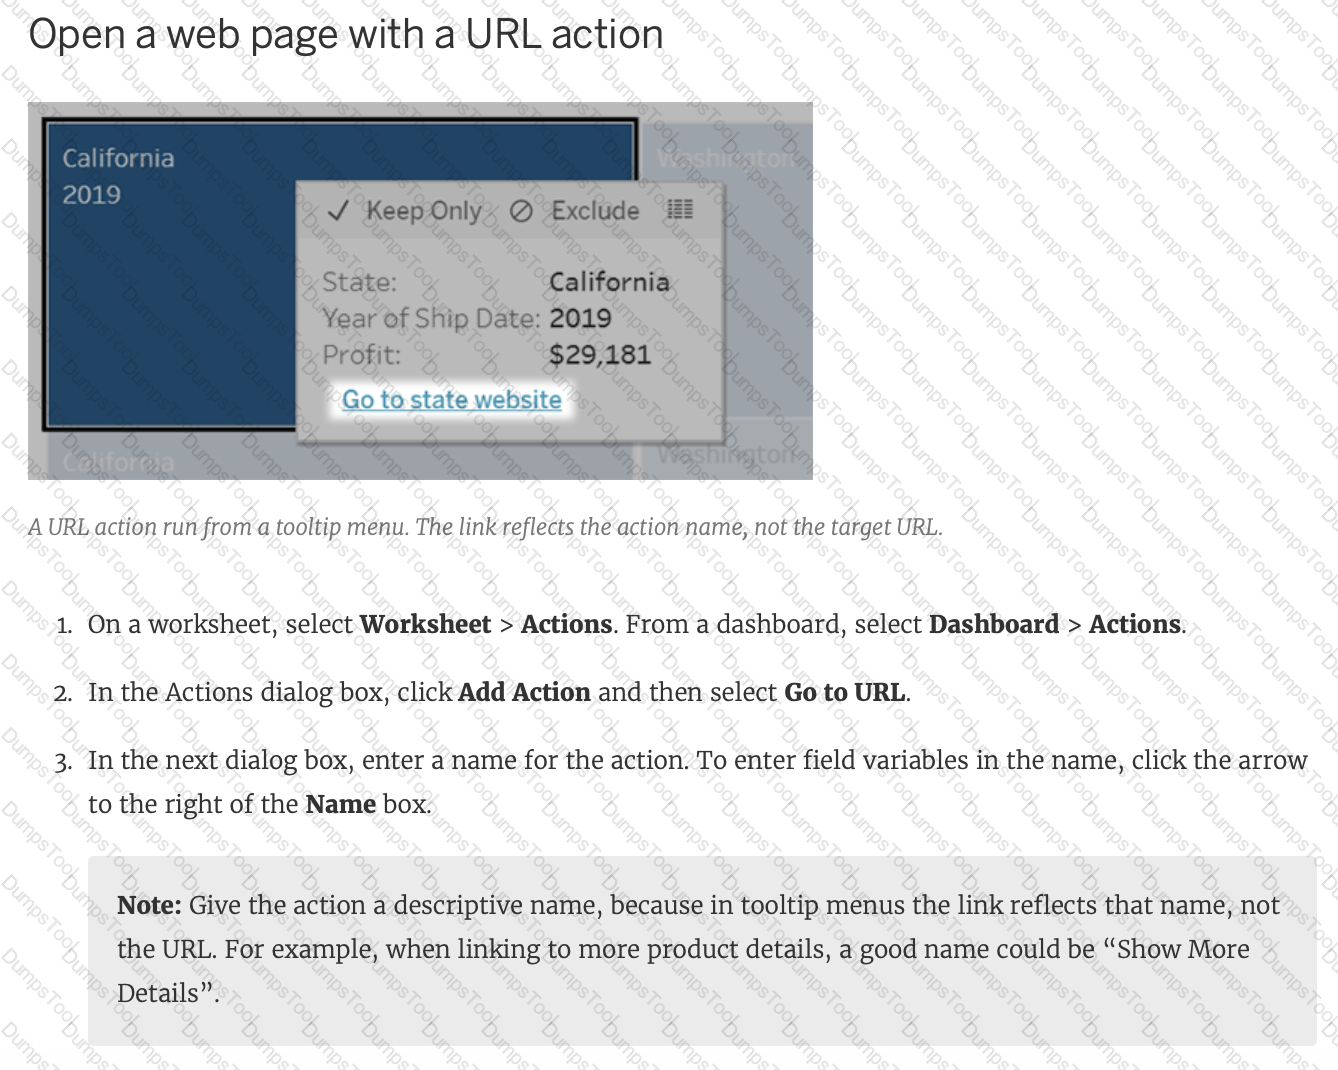
You have a dashboard that shows car rental statistics by city, including a field named Car Dropoff City in the view. A URL action in the dashboard uses https://en.wikipedia.org/wiki/
When you click Salt Lake City in the view, to where will the URL action direct you?
Which of the following are valid ways to make the font more readable in Tableau?
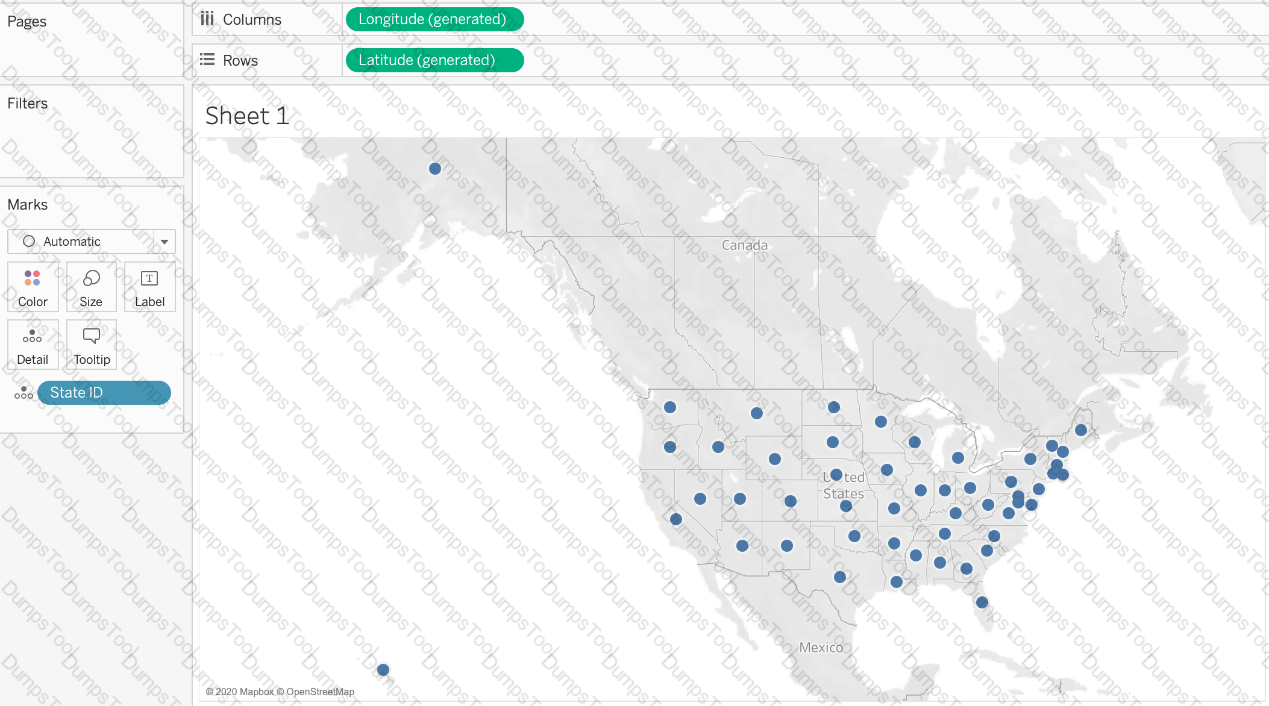
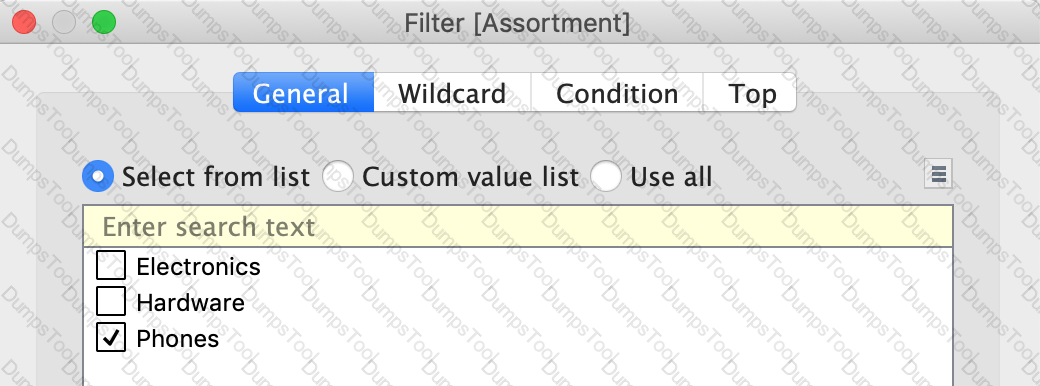
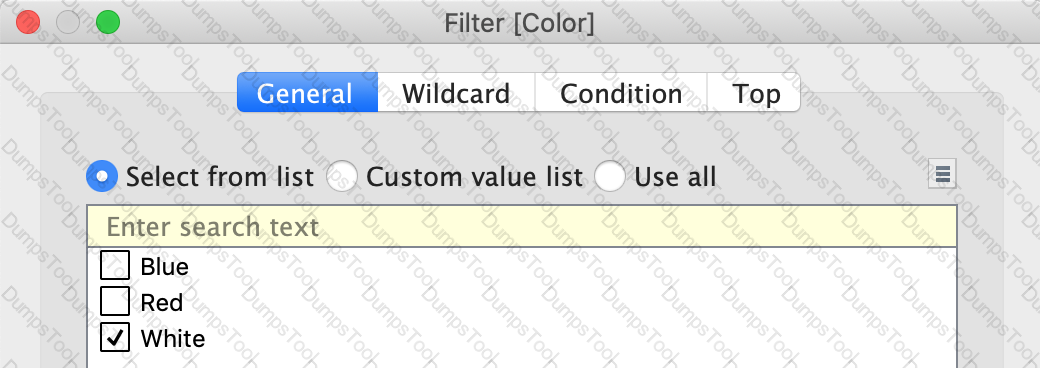
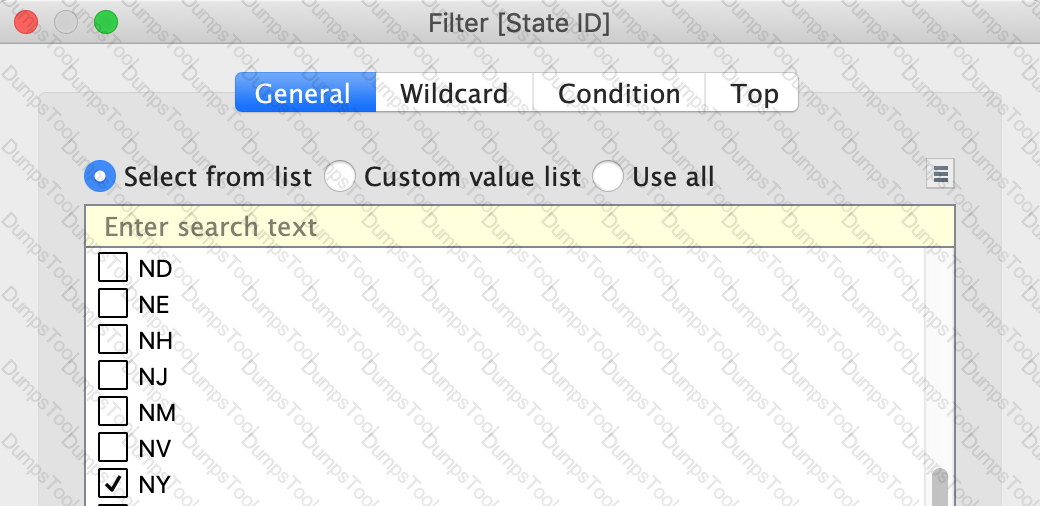
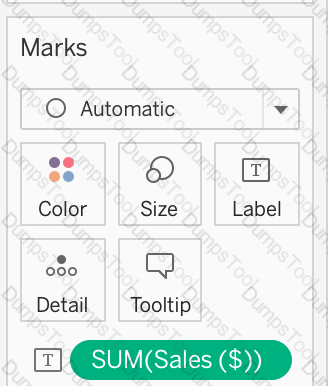
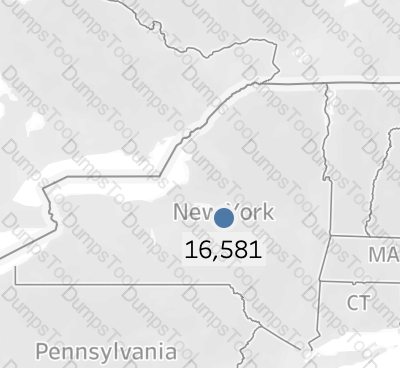
Using the Geo Data Table, create a Map showing Sales made per State. For the State of New York (NY), what was the amount in Sales ($) made for Phone Assortments with White color?
To customize links based on the data in your dashboard, you can automatically enter field values as _______________ in URLs
Which of the following URL prefixes are permitted when creating a URL Action in Tableau?
Skipped Join the Geo Data and Time Series Table on the Item Number ID column, and display the Store count for every State on a Map. What was the Store count in 2017 for Texas (TX)?
Join the Geo Data and Time Series Table on the Item Number ID column, and display the Store count for every State on a Map. What was the Store count in 2017 for Texas (TX)?
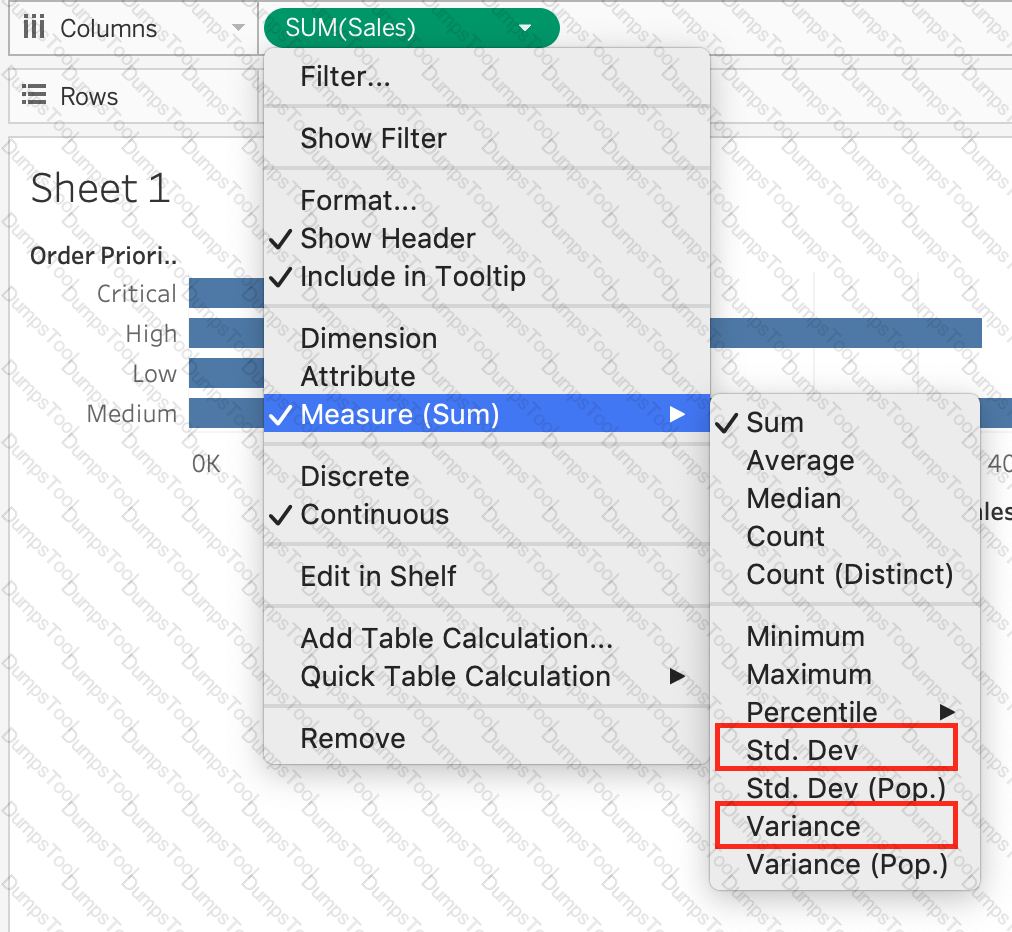
Is it possible to use measures in the same view multiple times (e.g. SUM of the measure and AVG of the measure)?
True or False: It is not possible to blend axes for multiple measures into a single axis
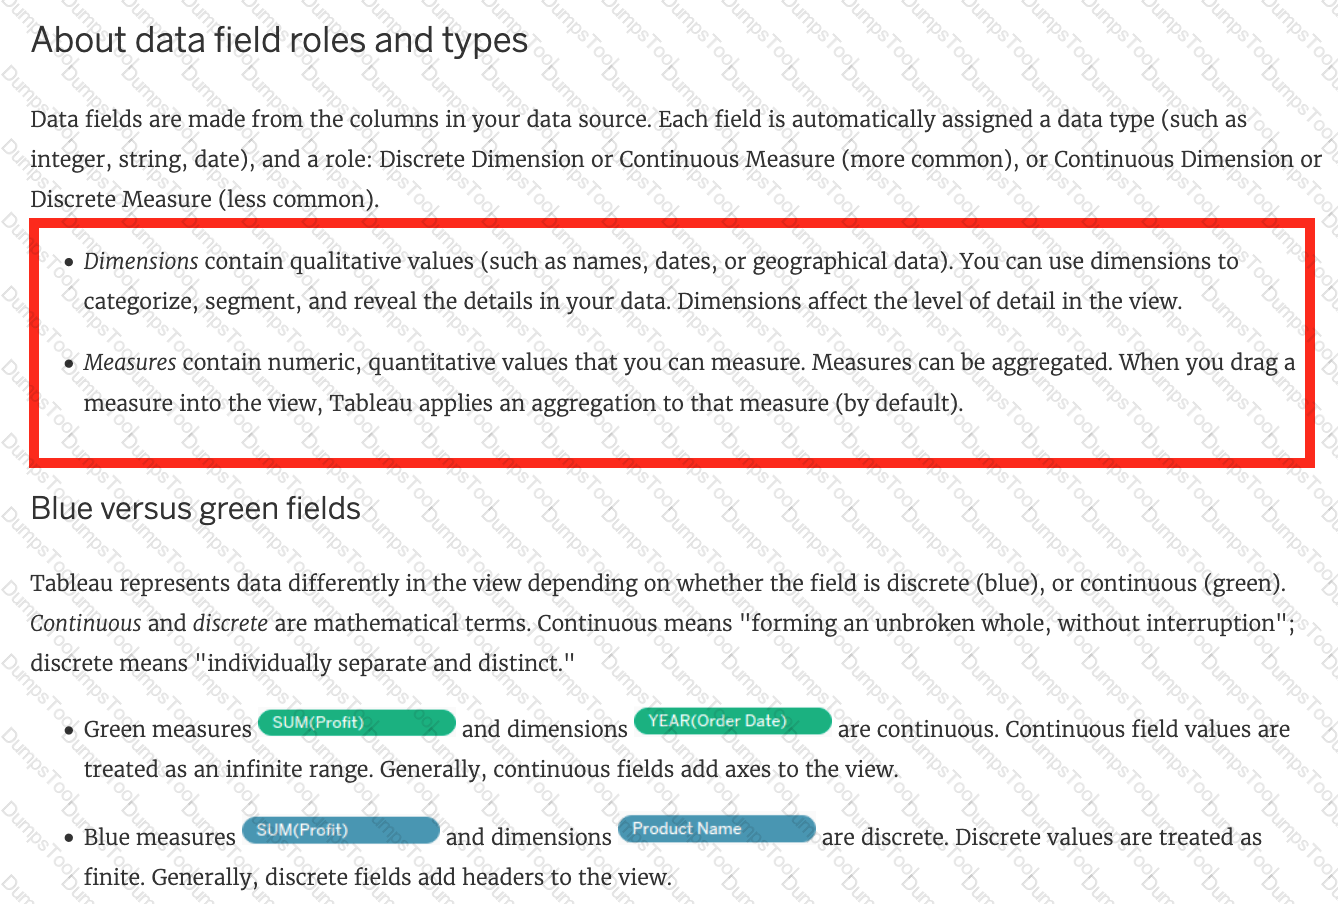
By default, measures placed in a view are aggregated. The type of aggregation applied ______________
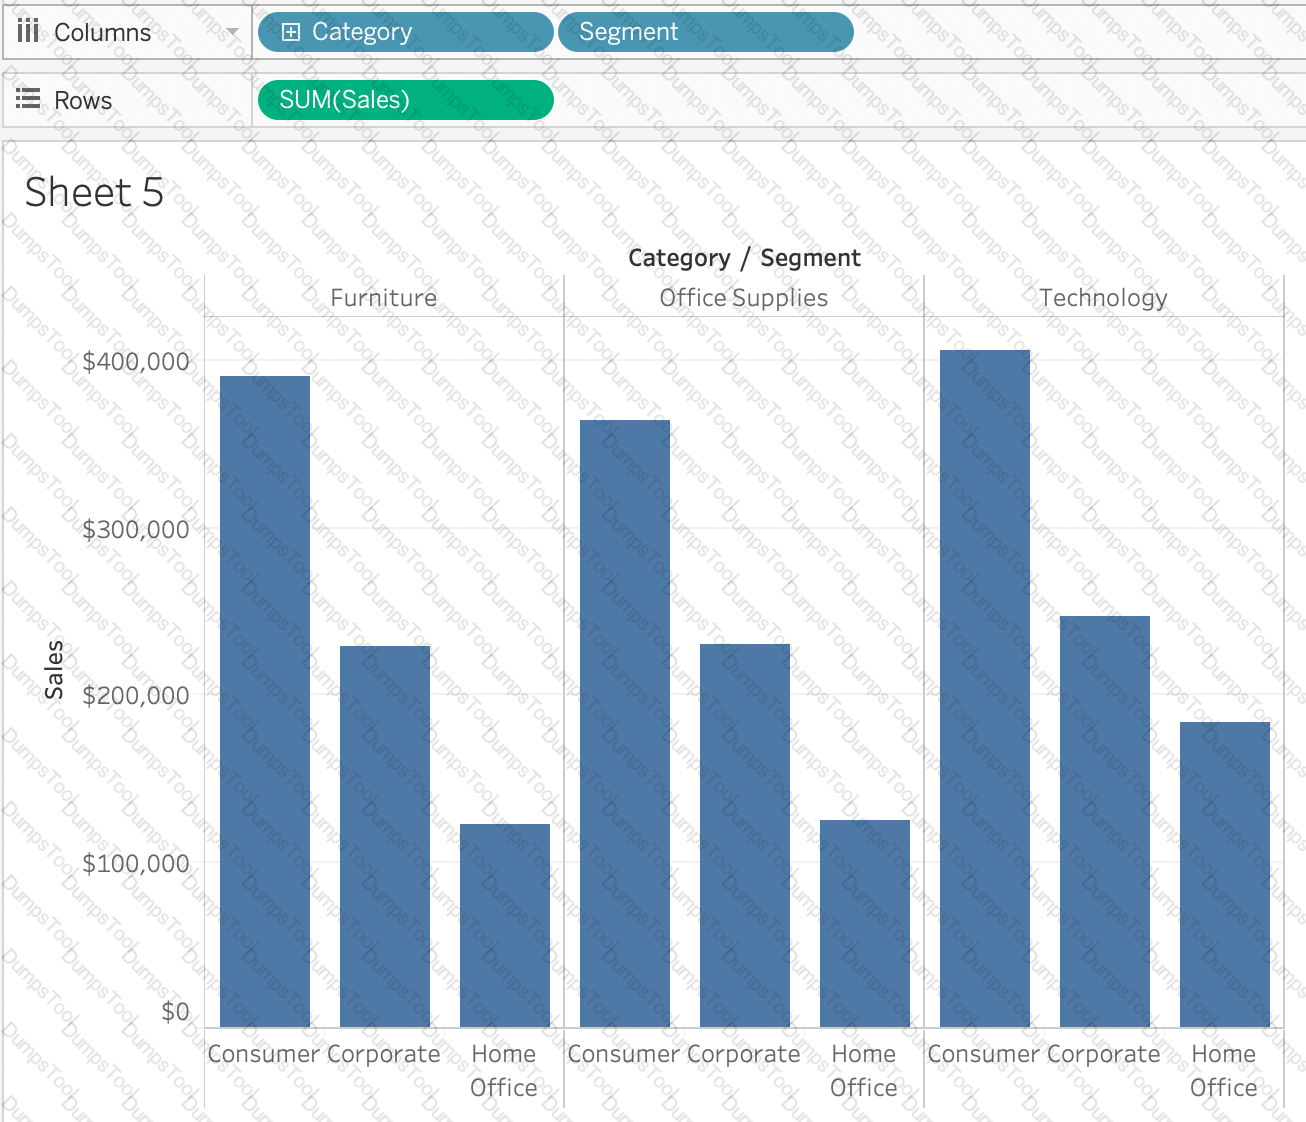
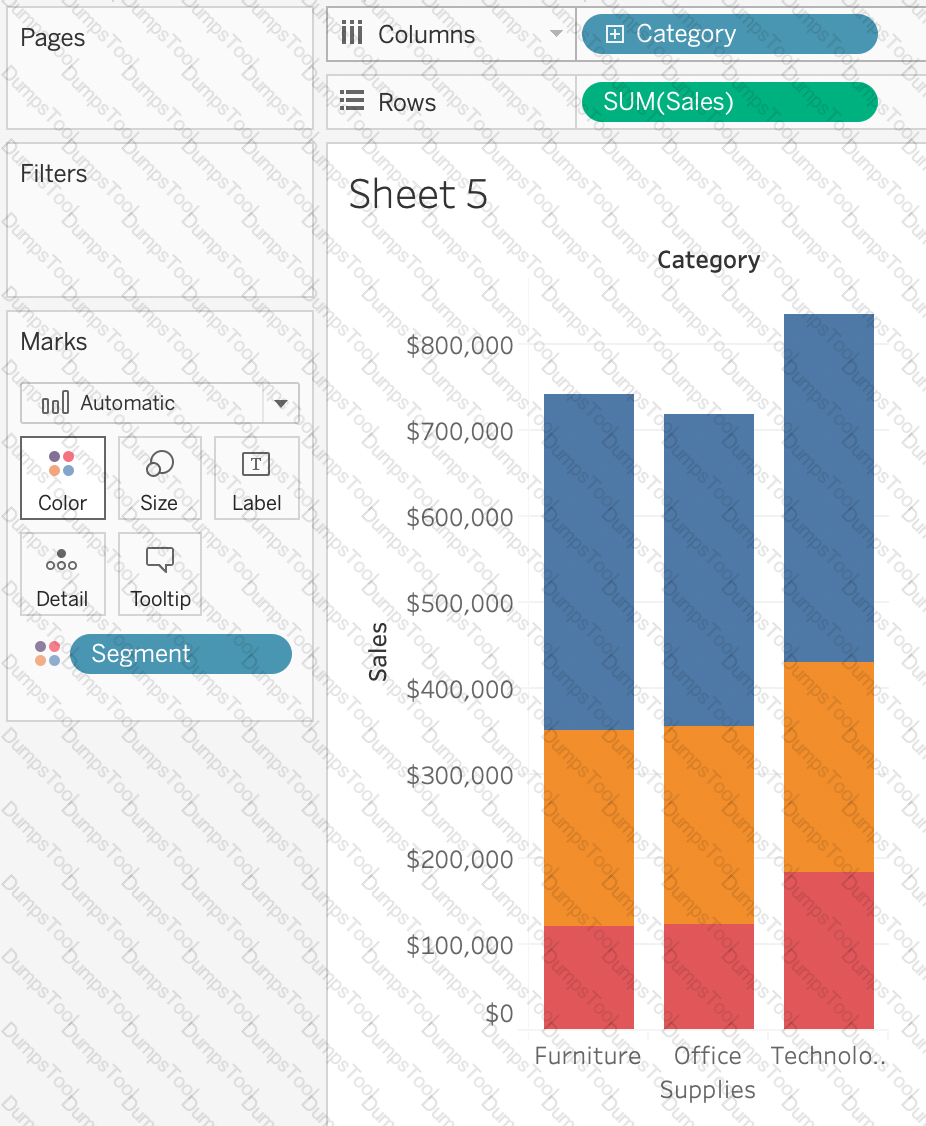
Suppose you create a bar chart by dragging a dimension to the Column shelf and a measure to the Rows shelf. Which of the following would create a stacked bar chart?
Using the Geo Data table, create a Bar chart showing the In-Stock percentage for each Color. What is the Average In-Stock percentage for the Color Red? Present your answer correctly upto 2 decimal places.
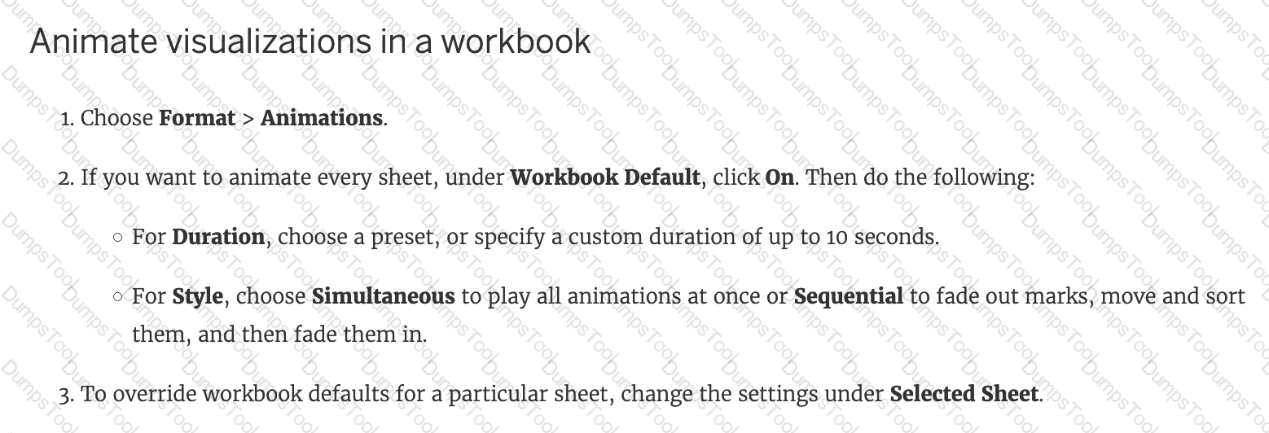
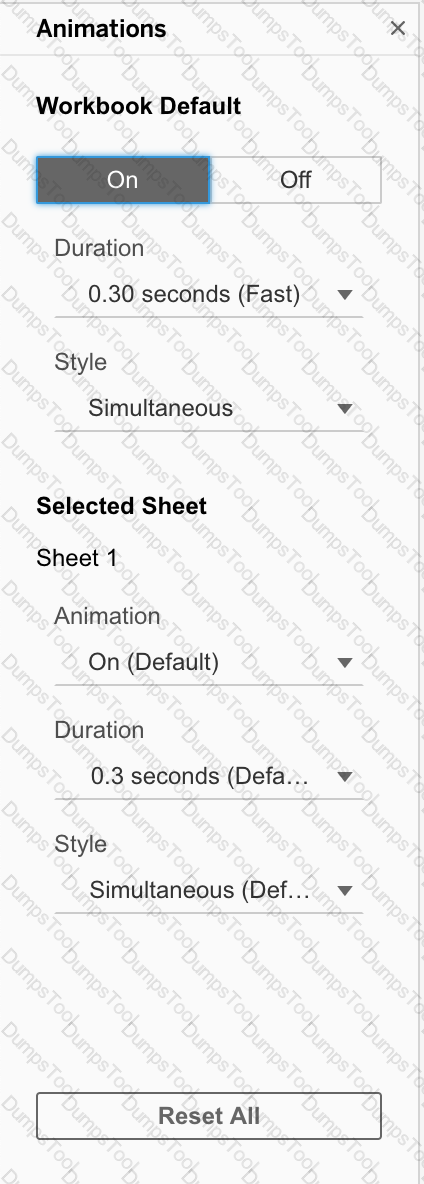
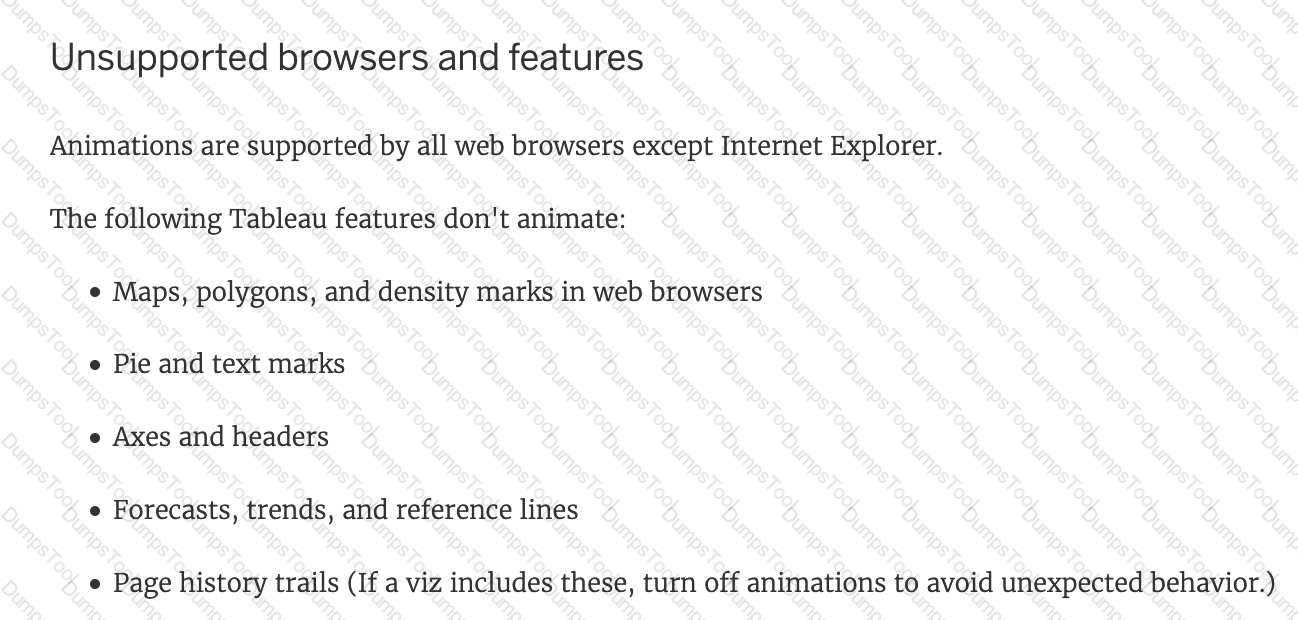
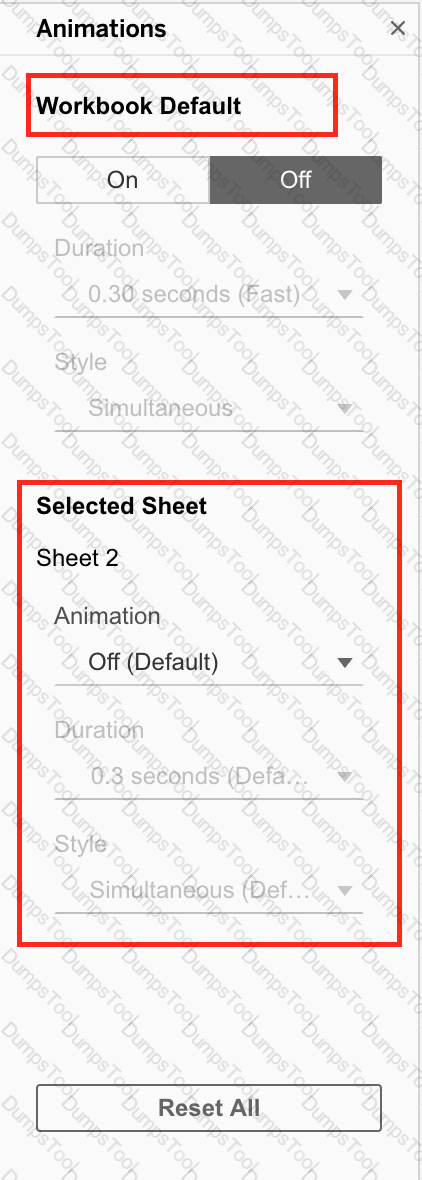
When using Animations in a Tableau, which of the following is the default duration for animations?
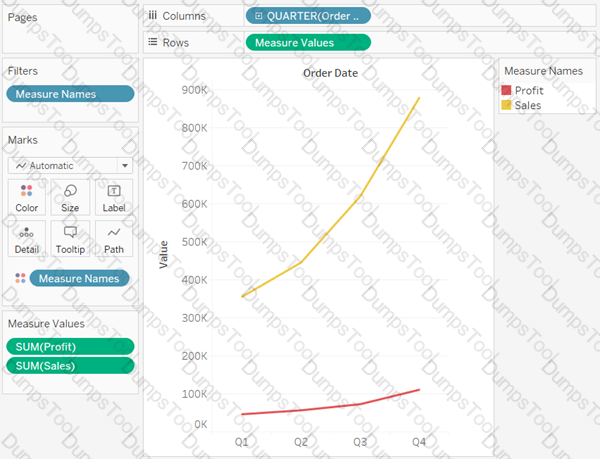
You have the following visualization.
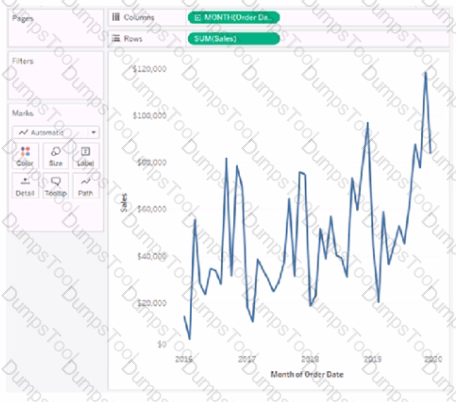
Where should you place a field named Region to show multiple distinct lines on the same axis?
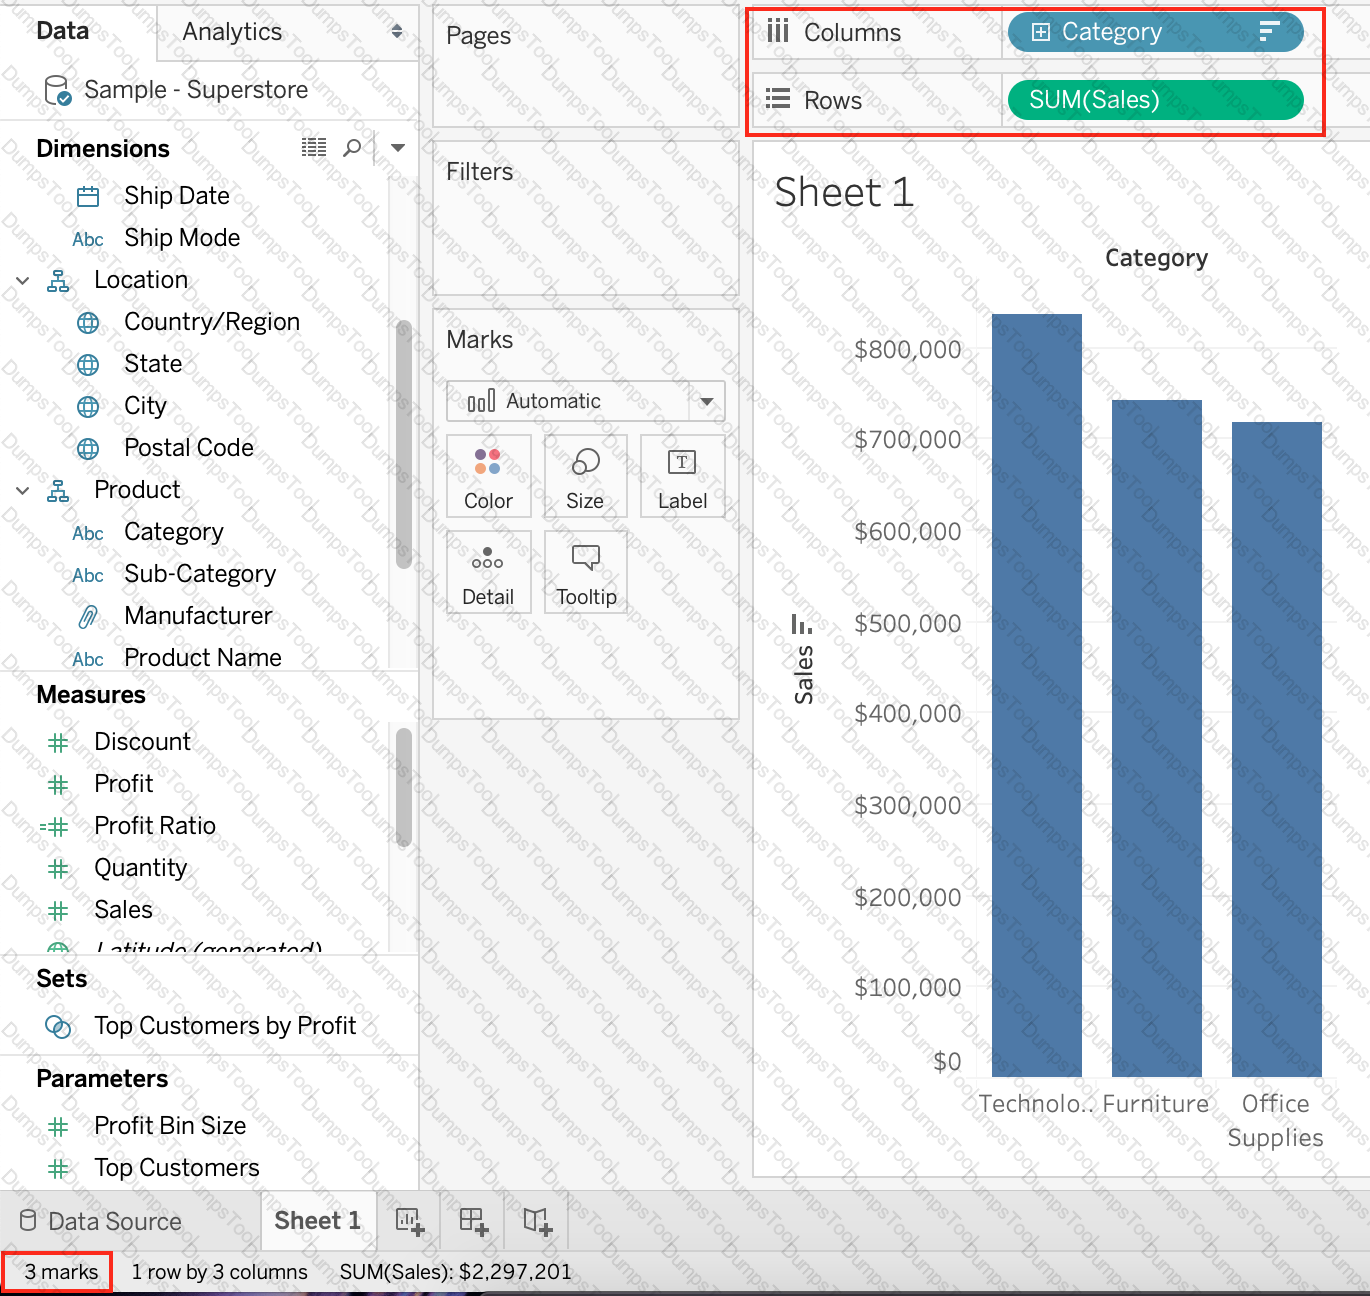
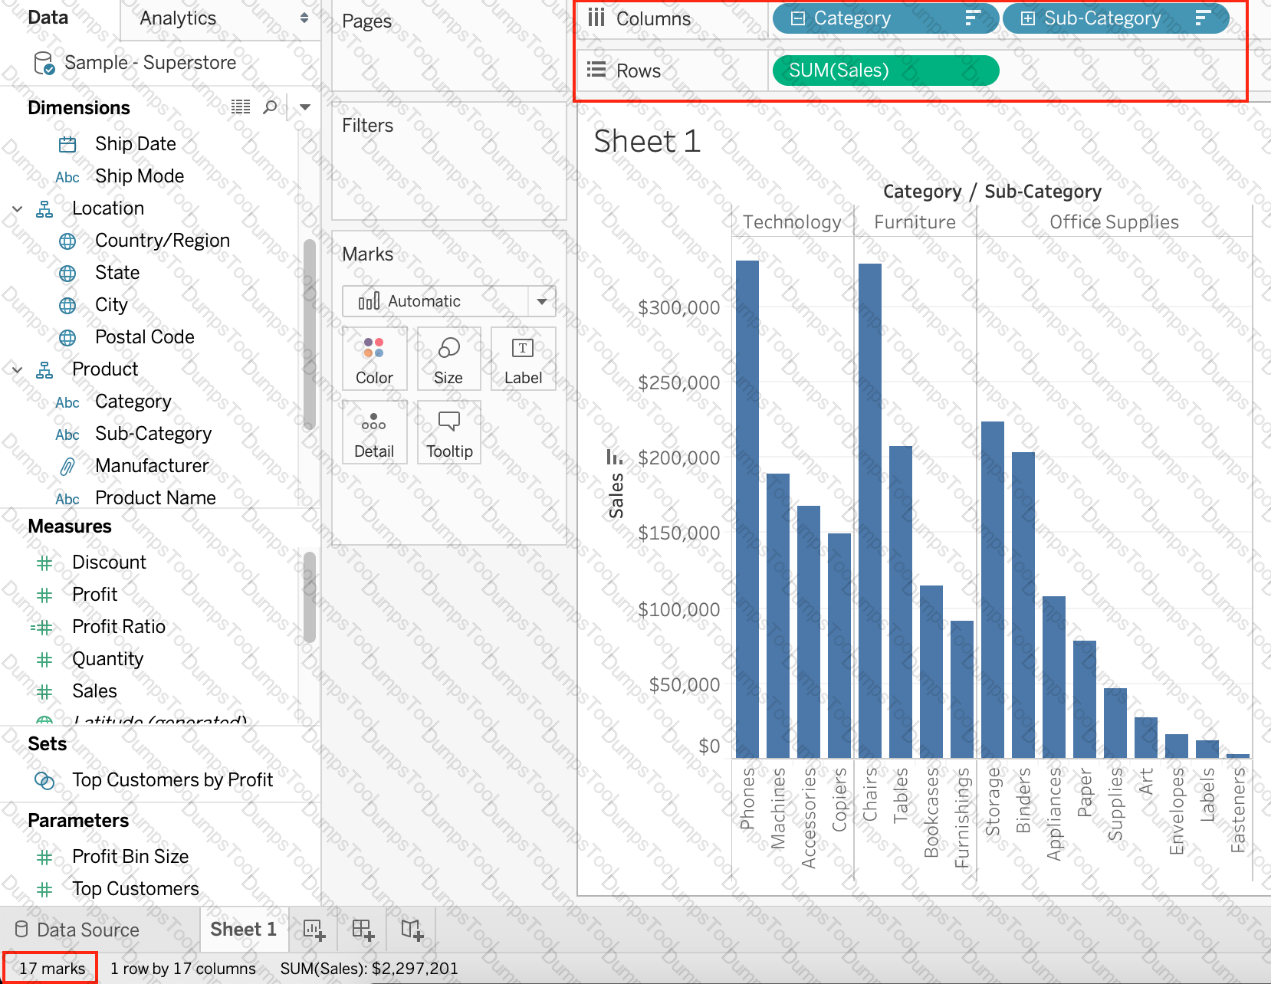
Yes or No: The number of marks will increase when you increase the number of Dimensions in a view
Which of the following is a benefit of using a Tableau Data Source (.tds)?
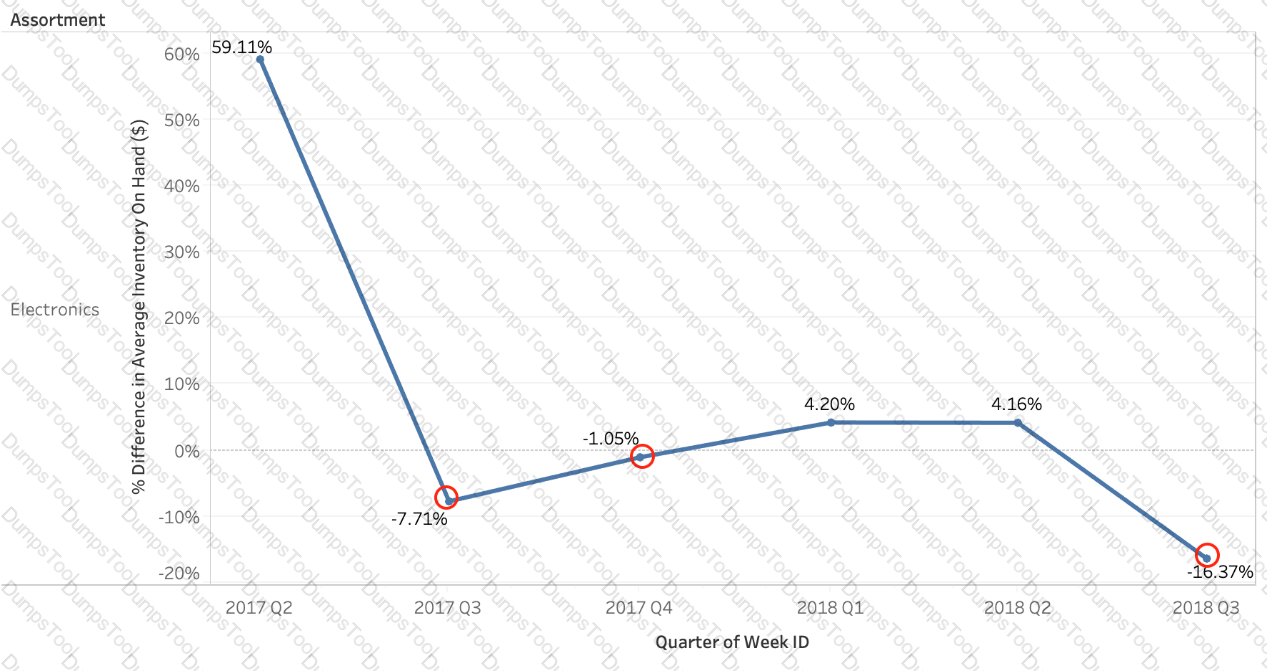
Using the Time Series table, create a chart that shows the percent difference in Average Inventory on Hand for each Assortment by year and quarter.
How many quarters did the Electronics Assortment show a negative percent difference in the Average Inventory On Hand?
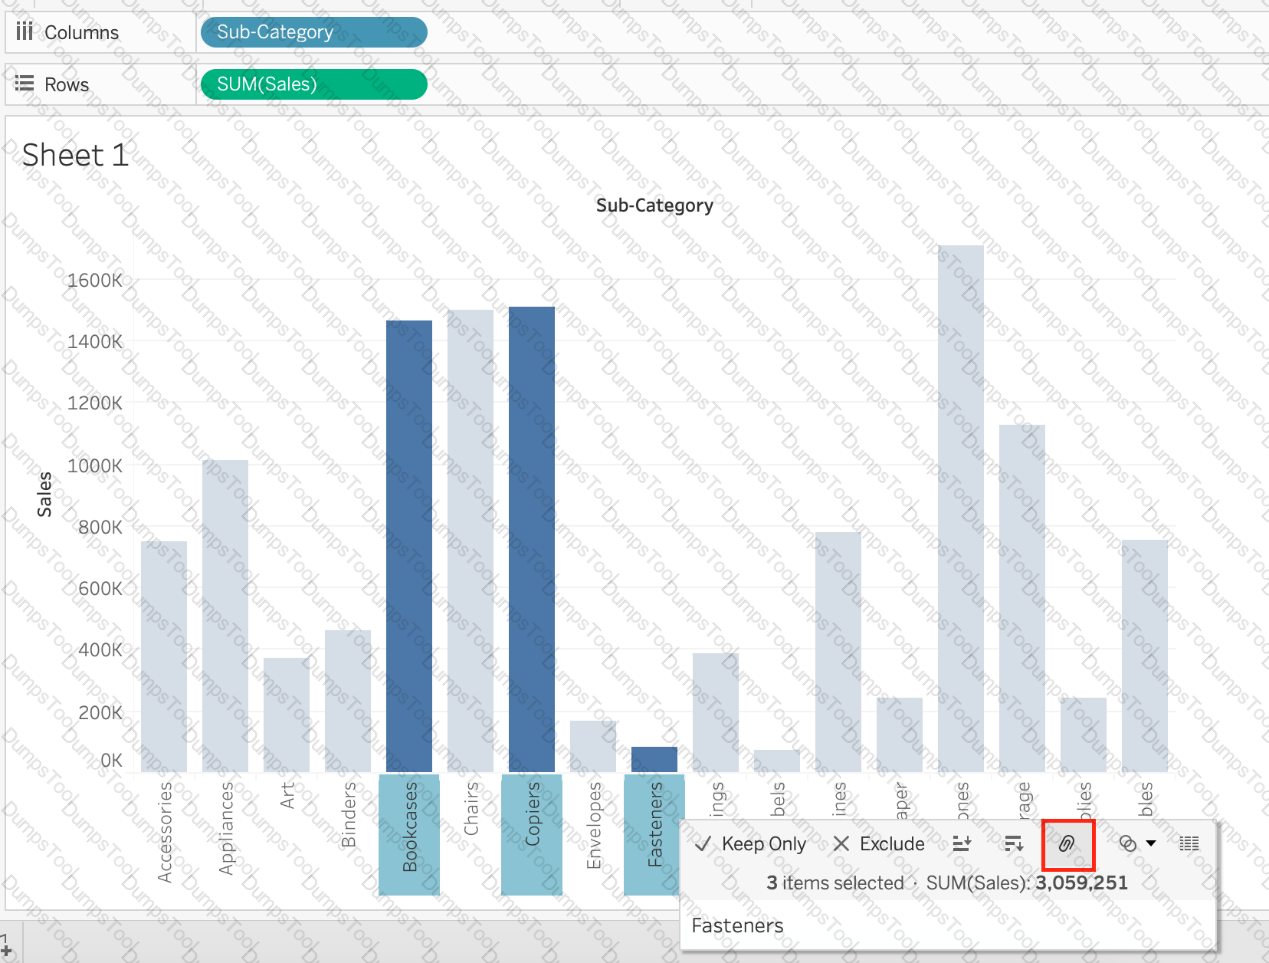
Which of the following can help us focus on specific data without removing data in the visualization?
As a general best practice, how many categories can a pie chart display effectively?
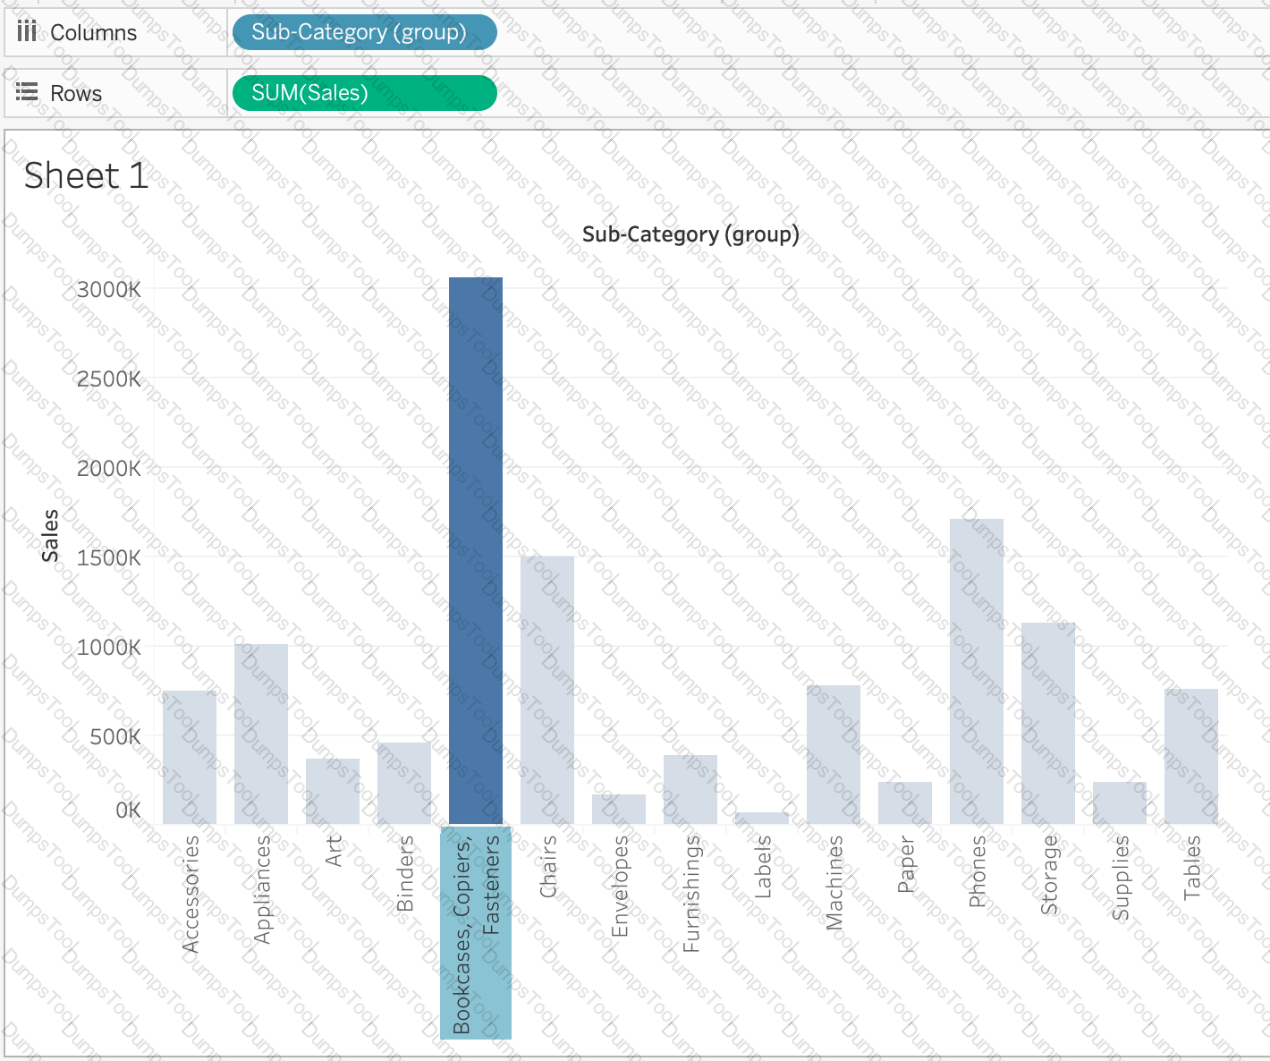
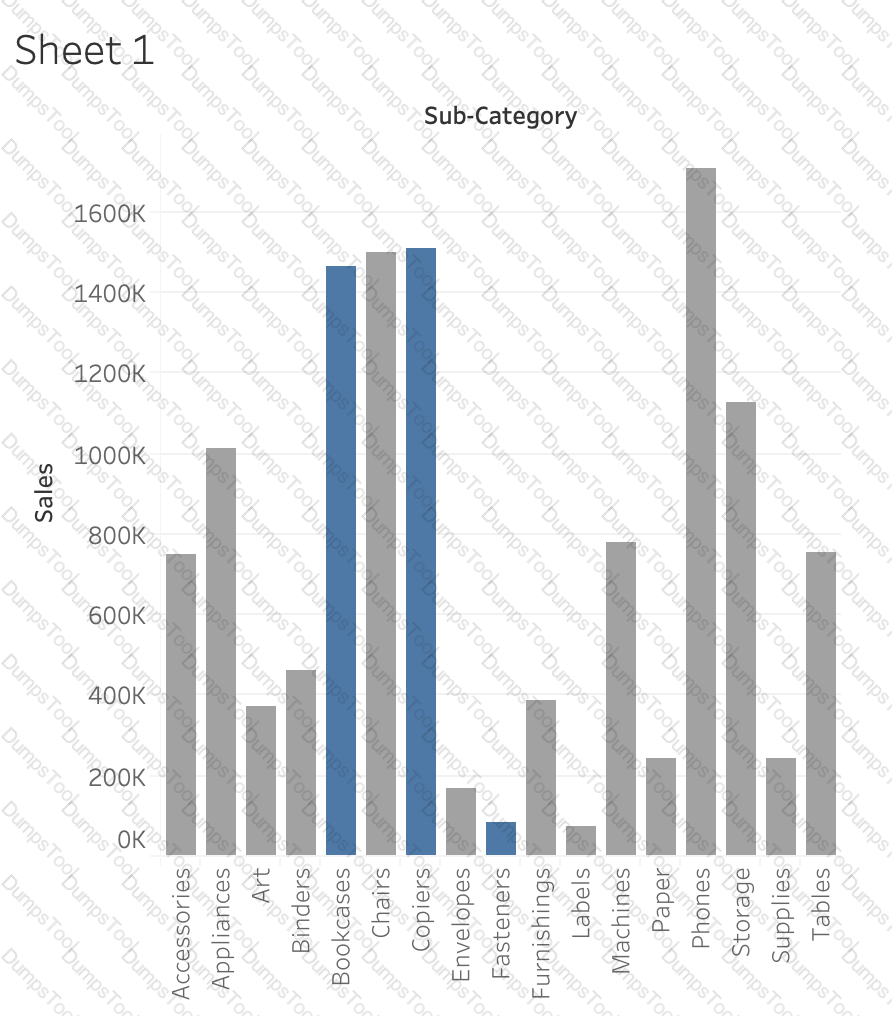
Suppose you have a bar chart. When we group by labels in a view, which of the following happens?
With the Marks card drop-down menu set to Automatic, a line chart will be created whenever you place what on the Rows shelf and the Columns shelf?
What should you use to apply bold text formatting to rows or columns independent of each other?
You have a data set that builds a union between two tables. You need to extract the data set. What should you use to extract the data set?
Which of the following is true about 'Incremental refresh' when creating Extracts in Tableau?
Tableau auto-generates ____________ dimension(s) and _____________ measure(s) for us
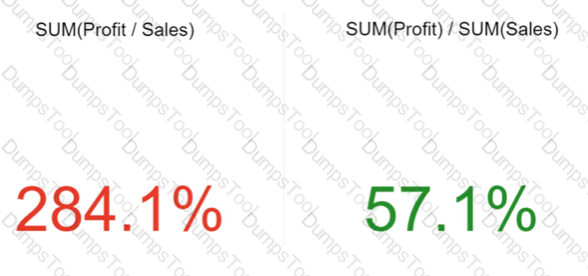
Which of the following is the correct way to calculate Profit Ratio in Tableau?
You have a workbook that contains one data source and you need to combine data from another database. What should you do first?
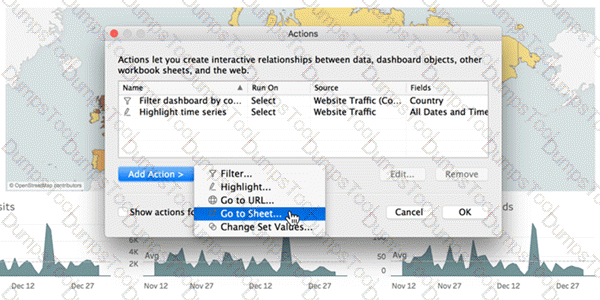
Which of the following are interactive elements that can be added to a dashboard for users?
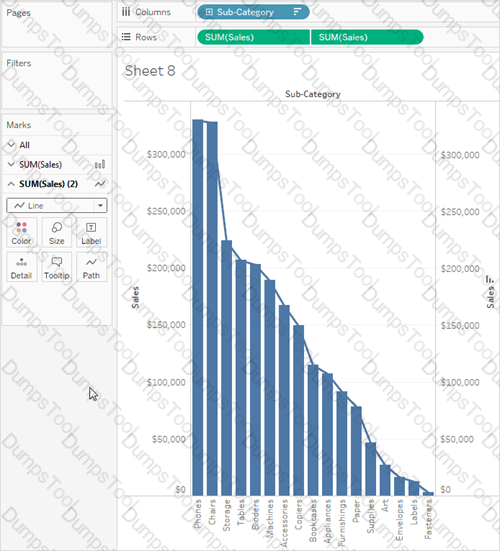
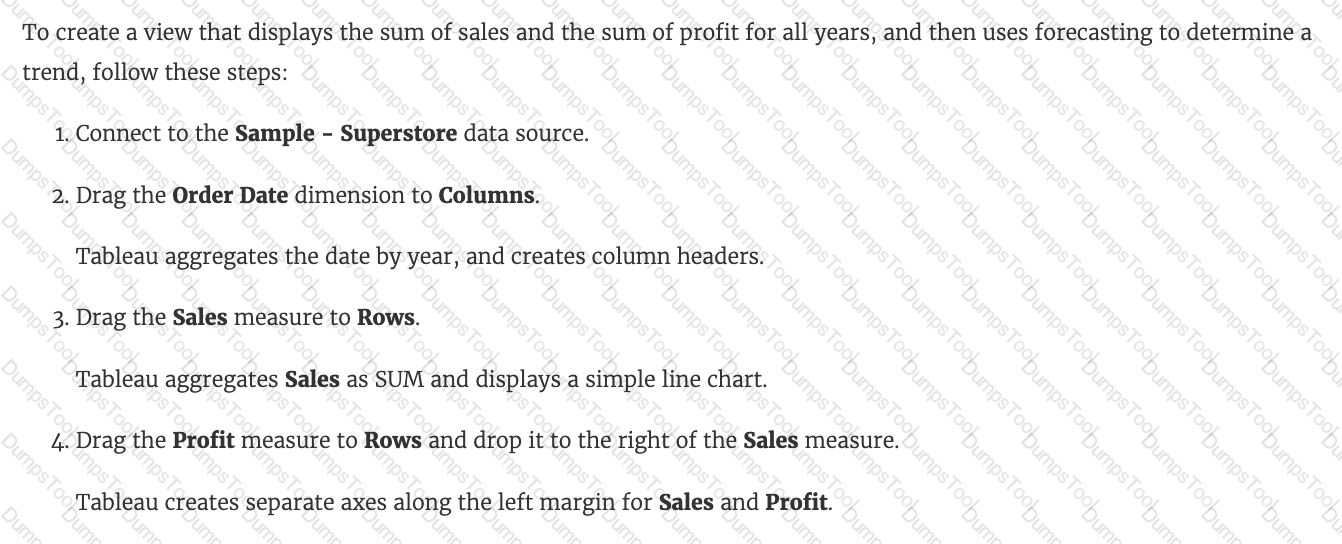
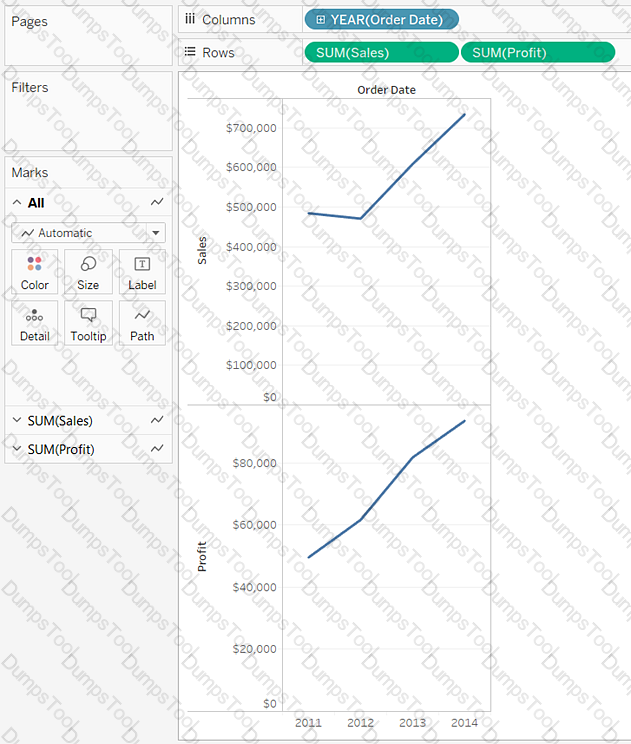
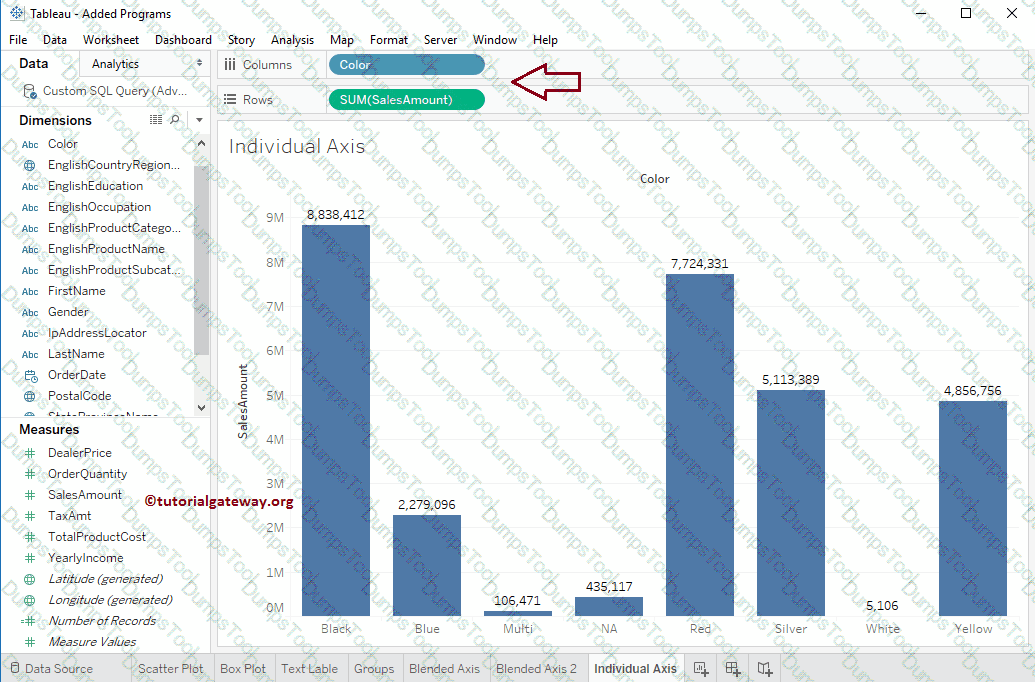
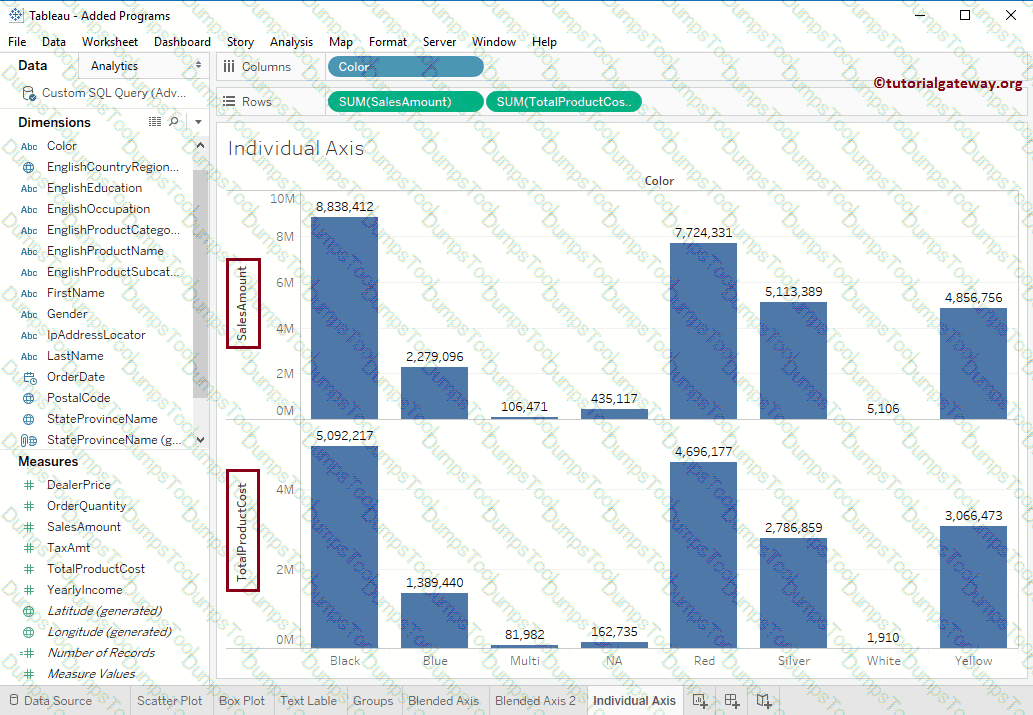
You are creating a combined axis chart.
Where should you drag the second measure after dragging the first measure to the Rows shelf?
What two methods can you use to change the font of a worksheet title? Choose two.
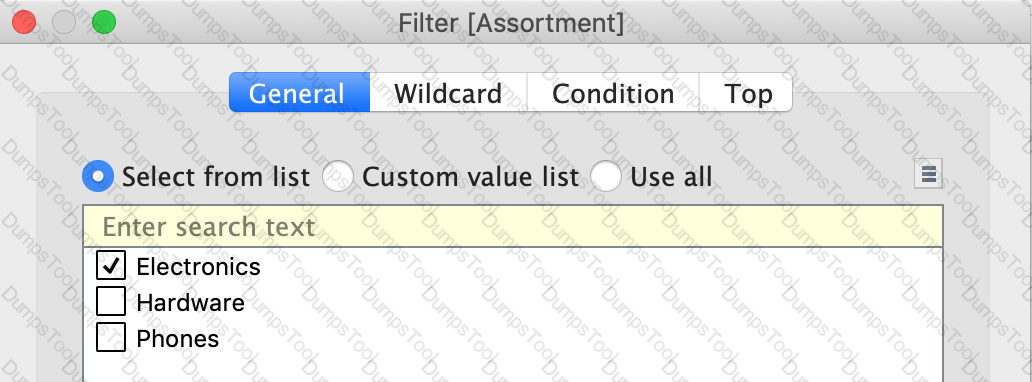
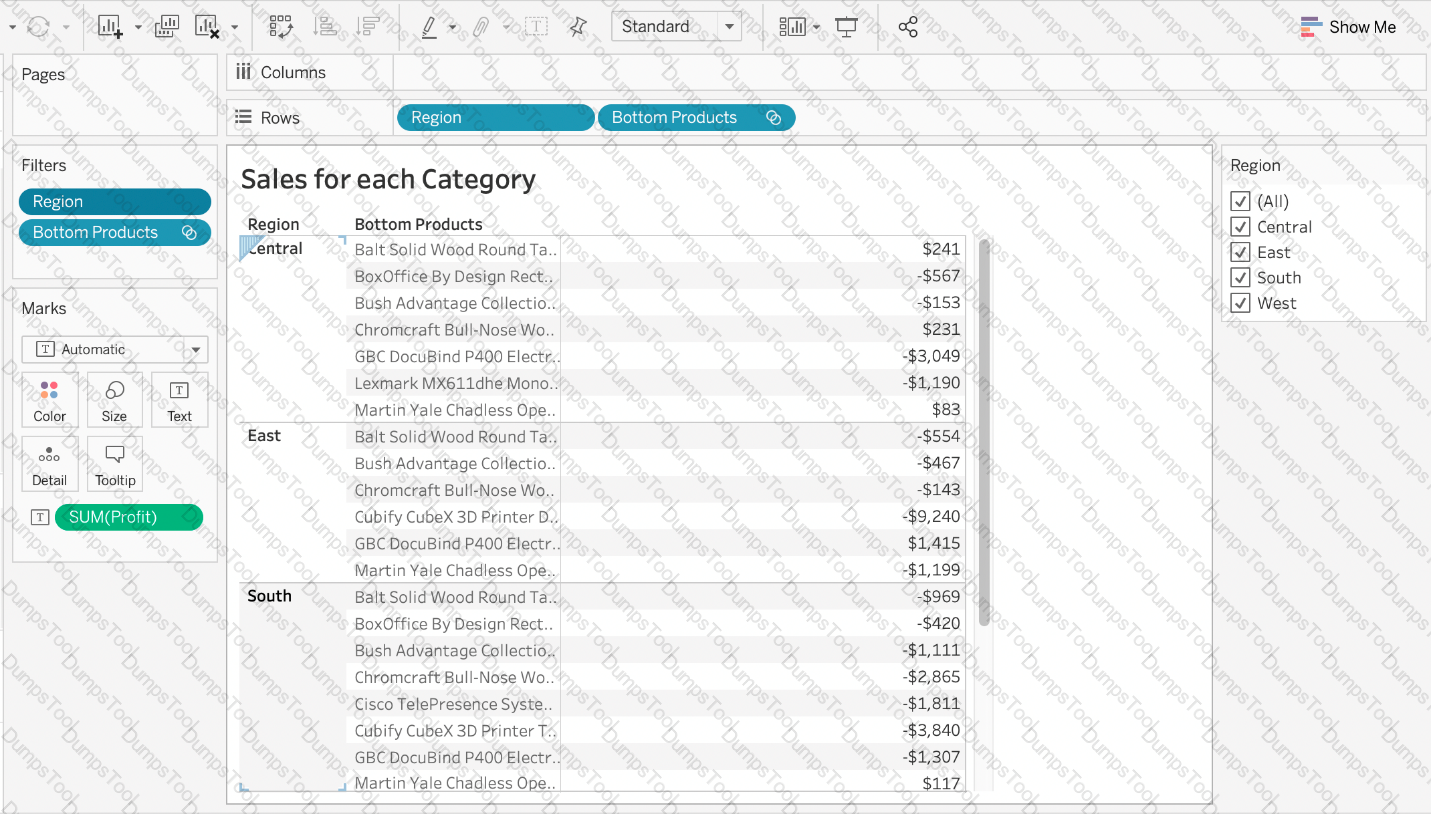
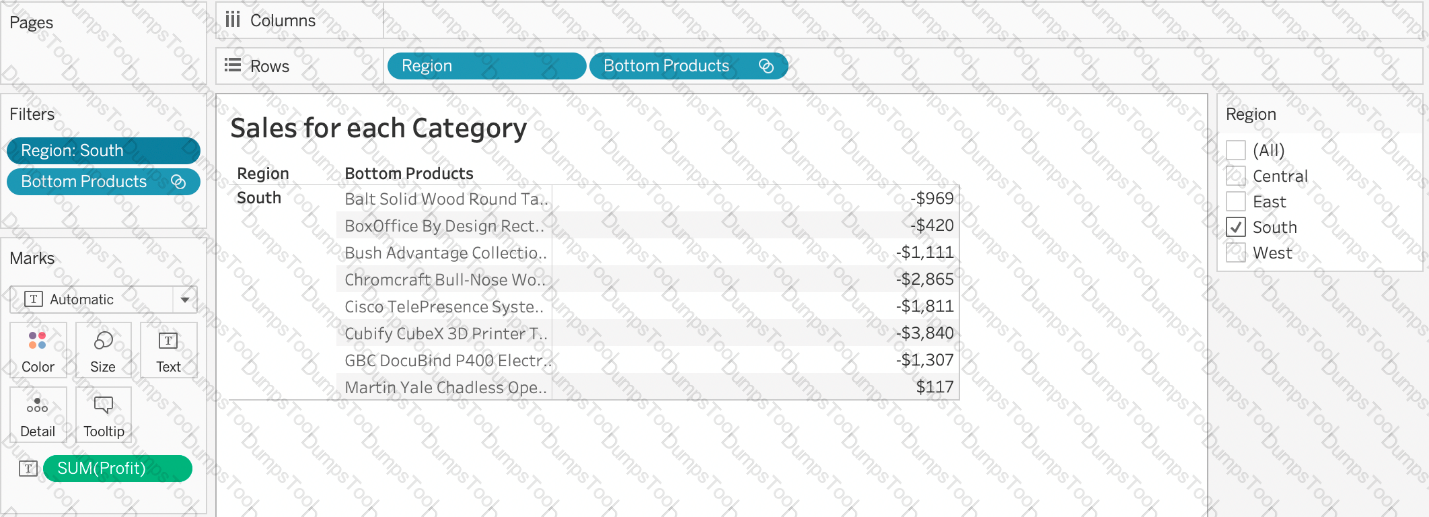
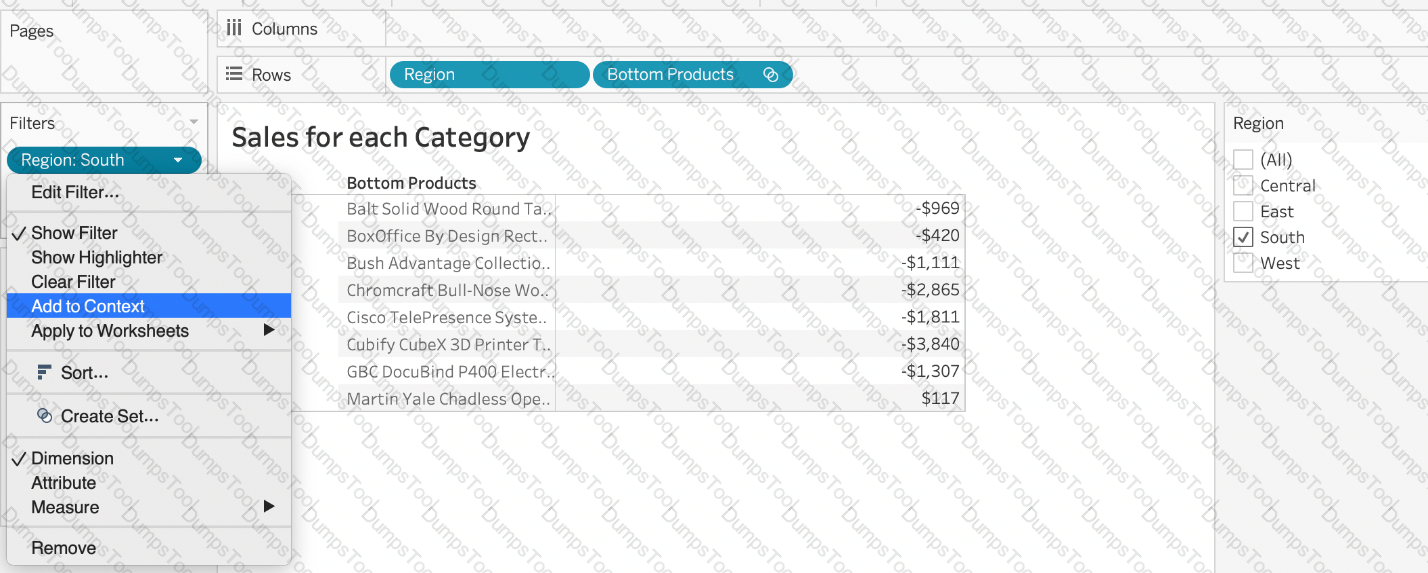
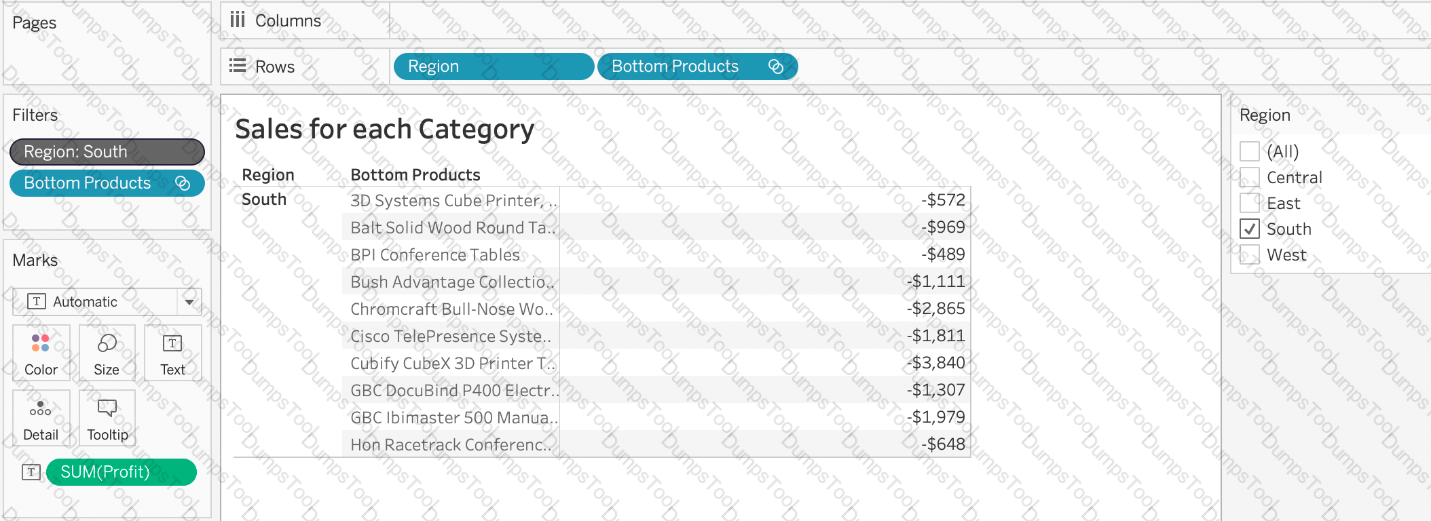
Our use case states that we need to create a set showing the Bottom 10 products by Profit in each Region. Which of the following filter types should you apply on Region?
True or False: Enabling any other type of sort (Field, alphabetic, or Nested) clears the manual sort we create.
Which chart type uses automatically generated sizes that cannot be resized by using the Marks card?
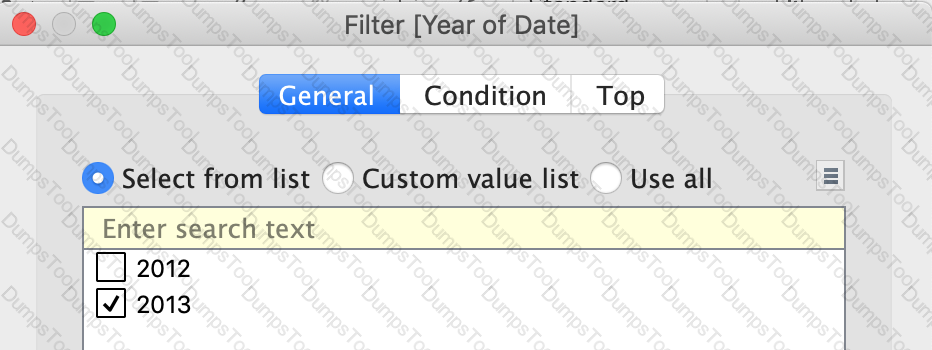
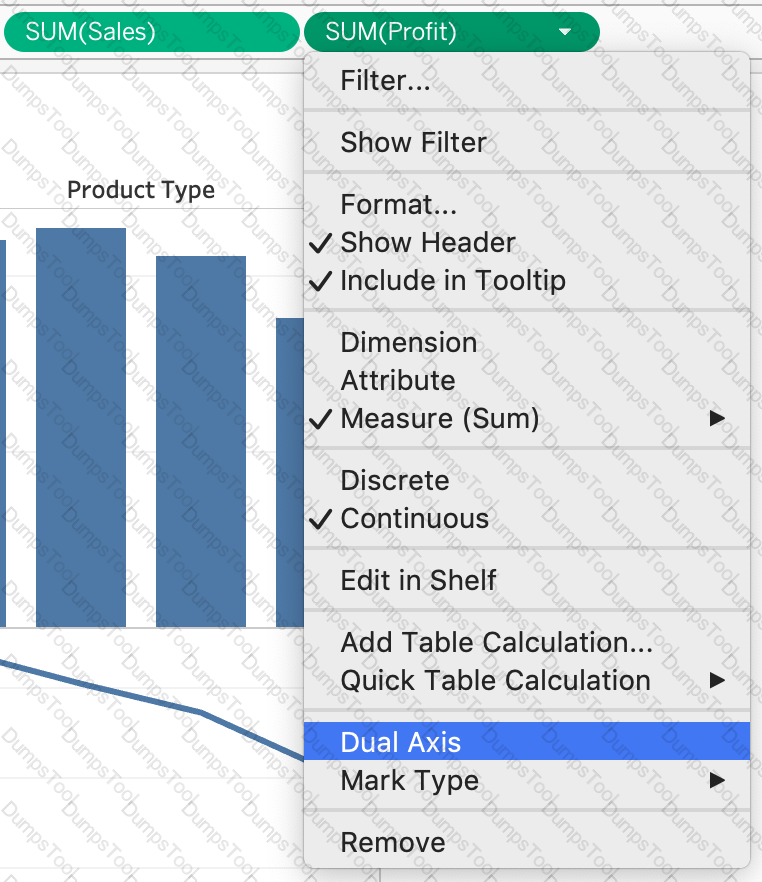
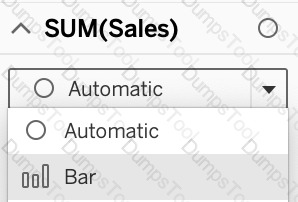
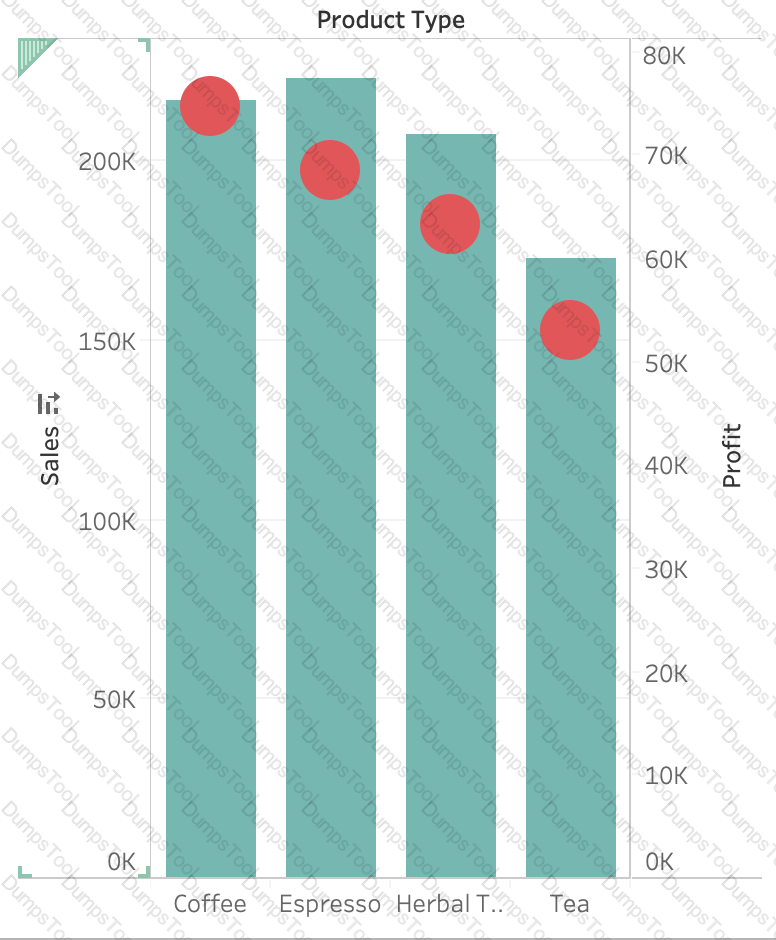
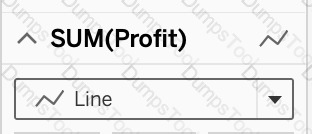
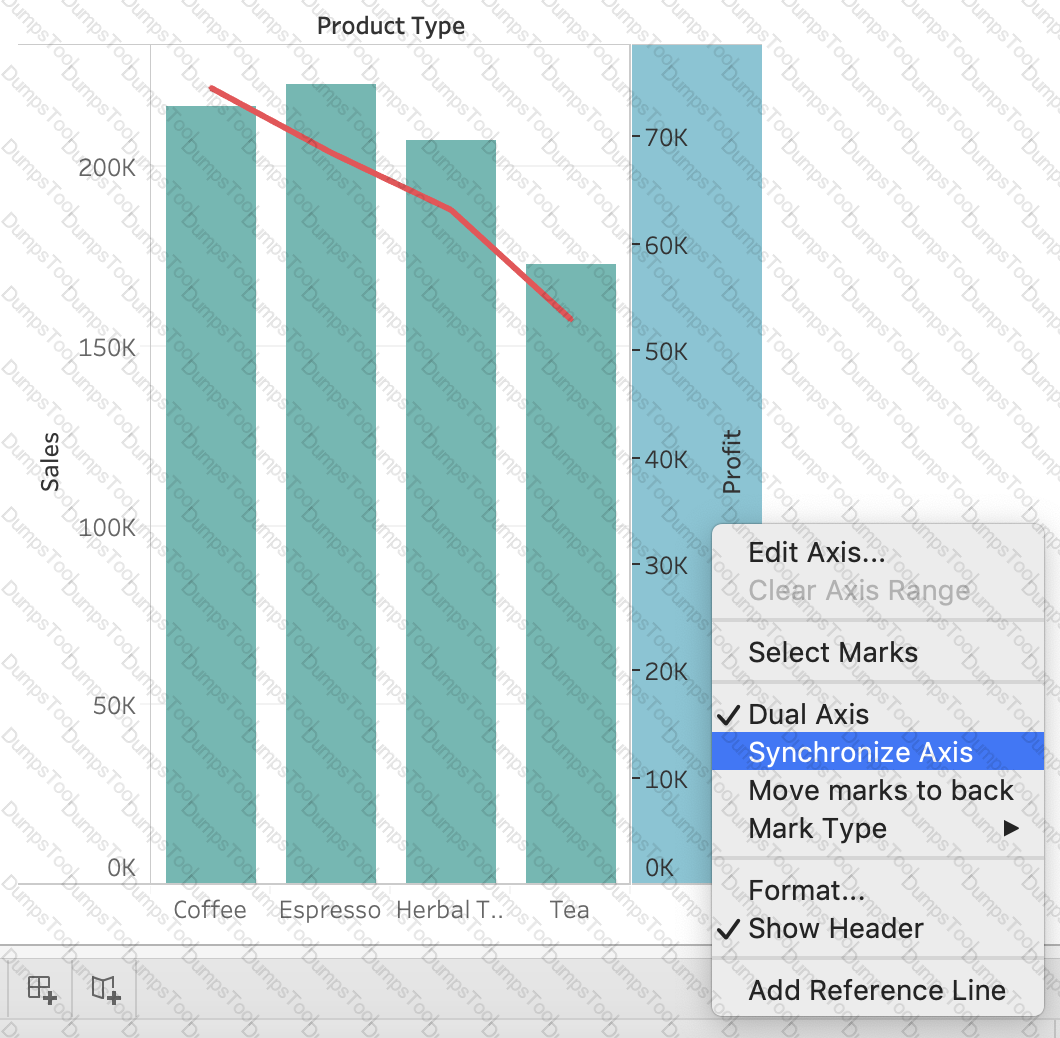
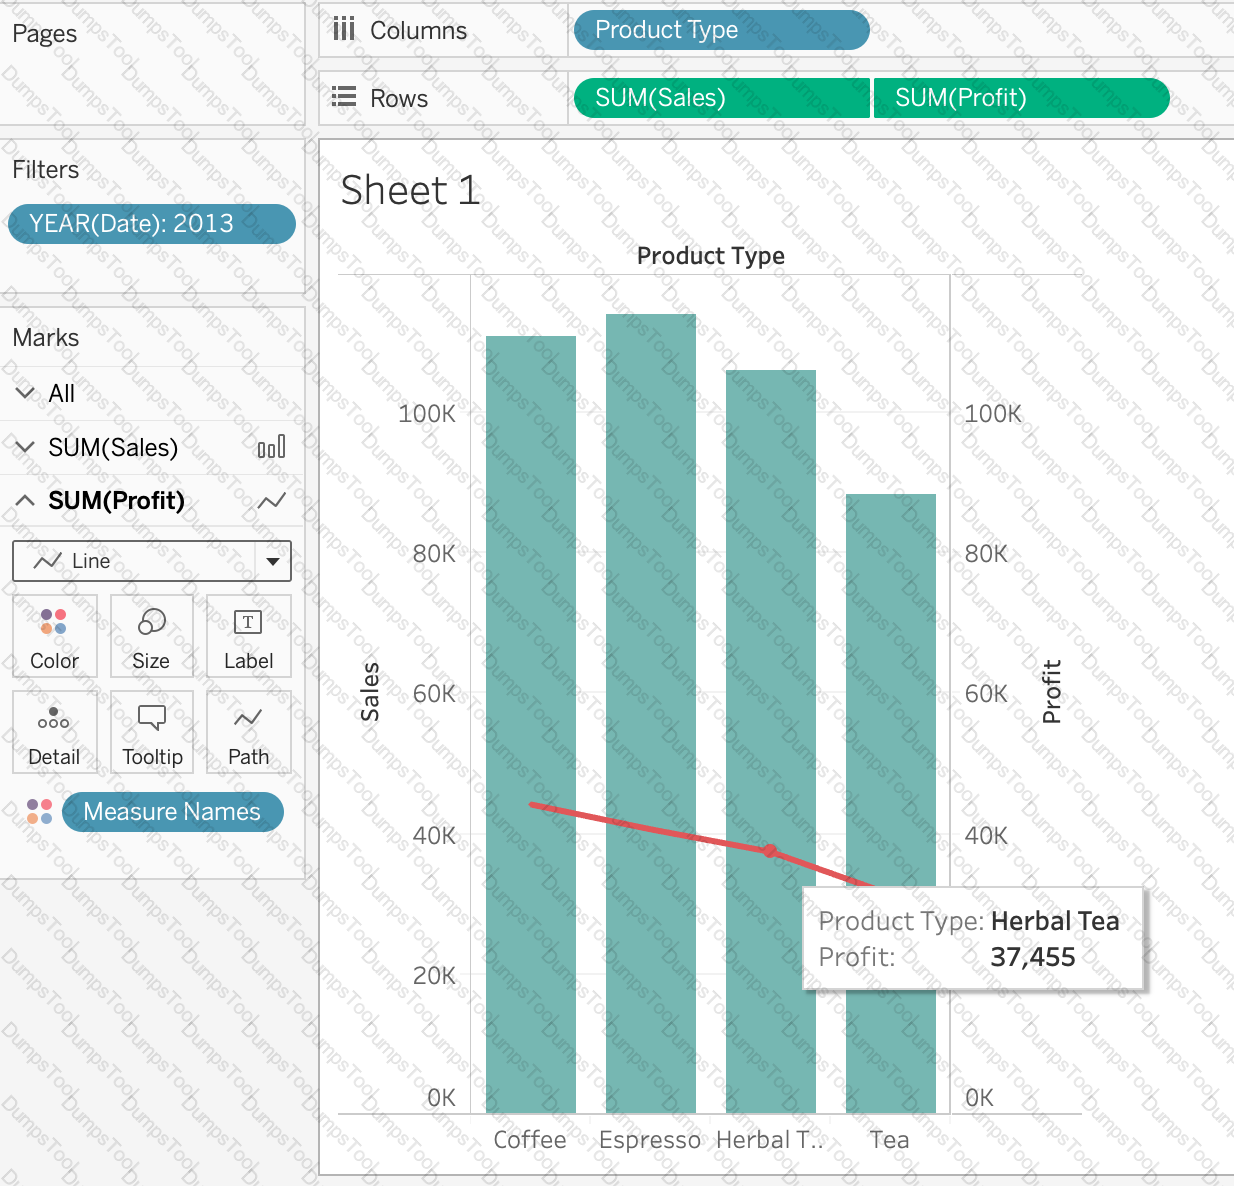
Using the CoffeeChain table, create a Dual Axis chart showing the Sales (Bar chart) and Profit (Line Chart) for each Product type. What was the Profit for the Herbal Tea product type in 2013?
You need to invert the color intensity of a quantitative range. Which option should you use?
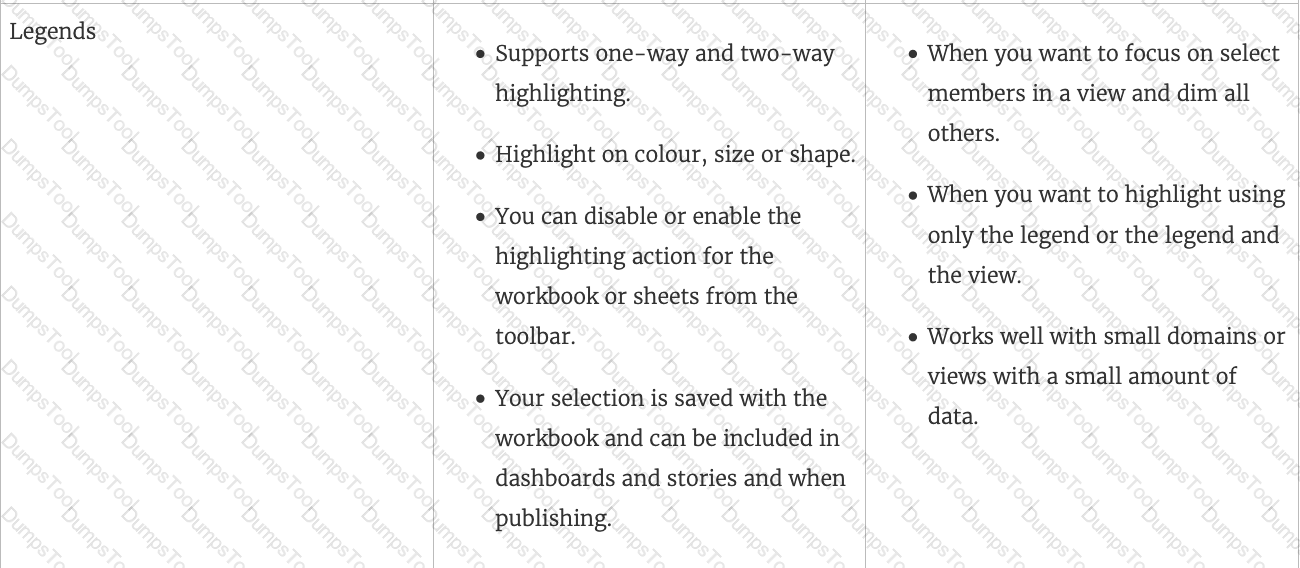
True or False: The Highlighting action can be disabled for the entire workbook.
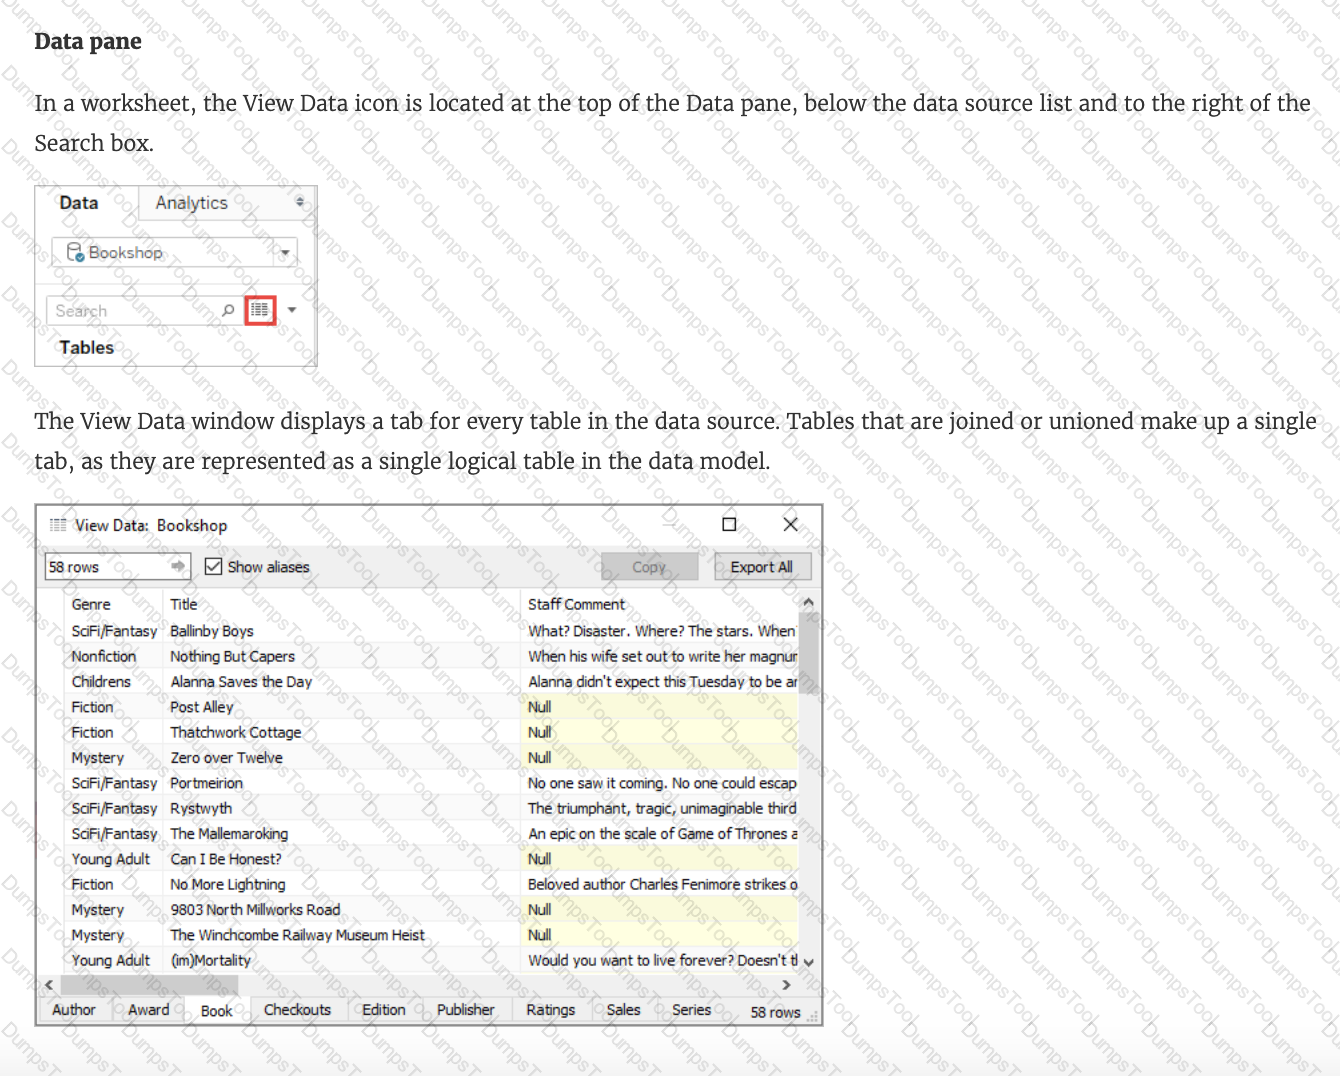
The View Data window displays as much of the data as possible by default, up to _______________ rows.
Which three elements are included in a packaged workbook (.twbx)? Choose three.
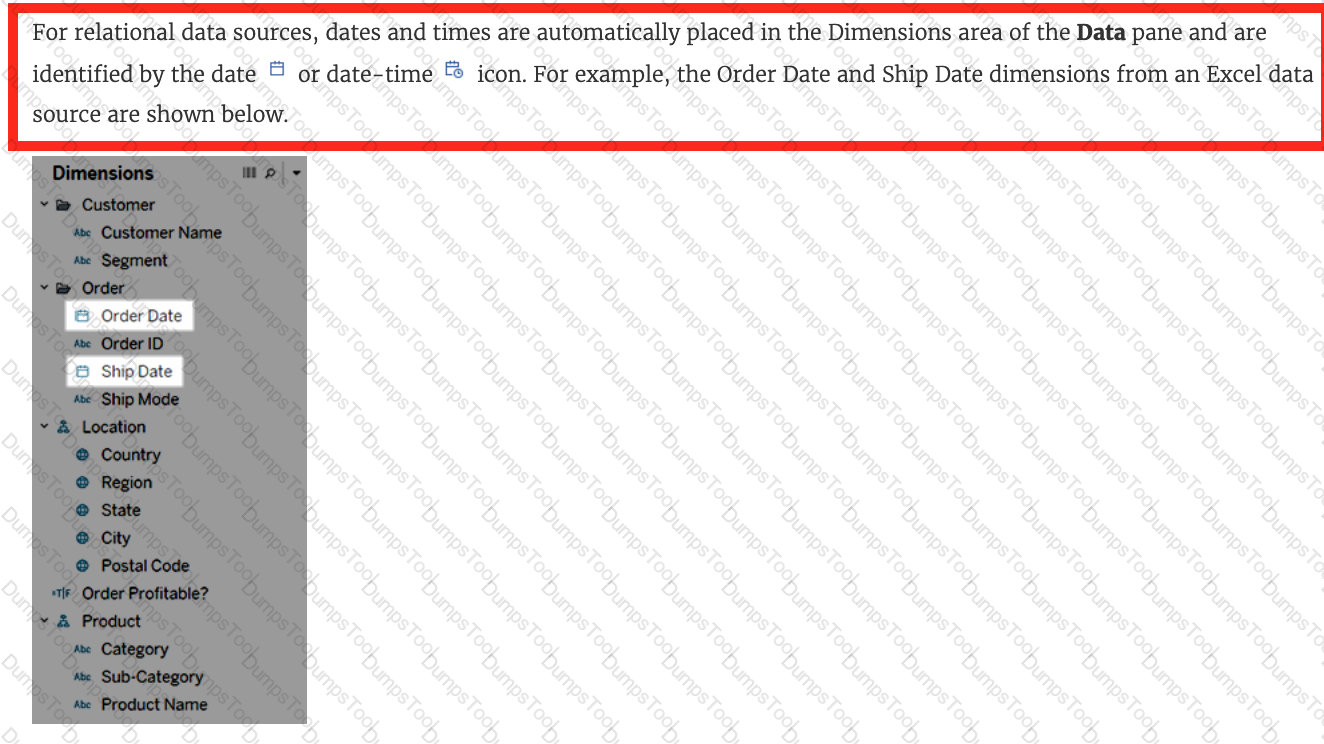
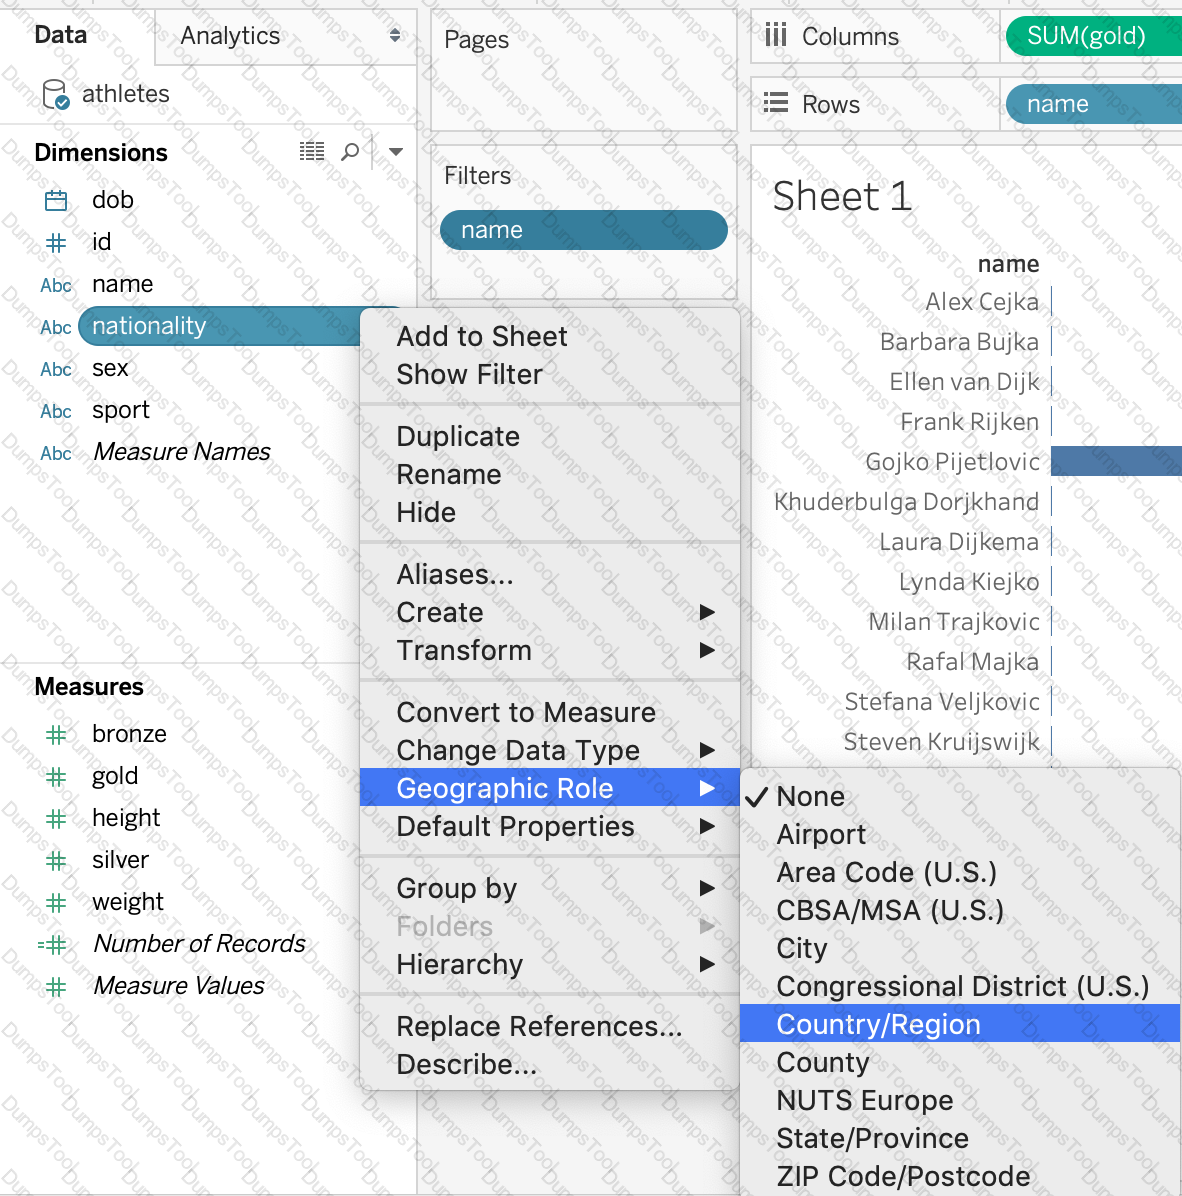
How can you MANUALLY assign geographic roles to a dimension from the data pane?
In an extract, what are three differences between a full refresh versus an incremental refresh? Choose three.
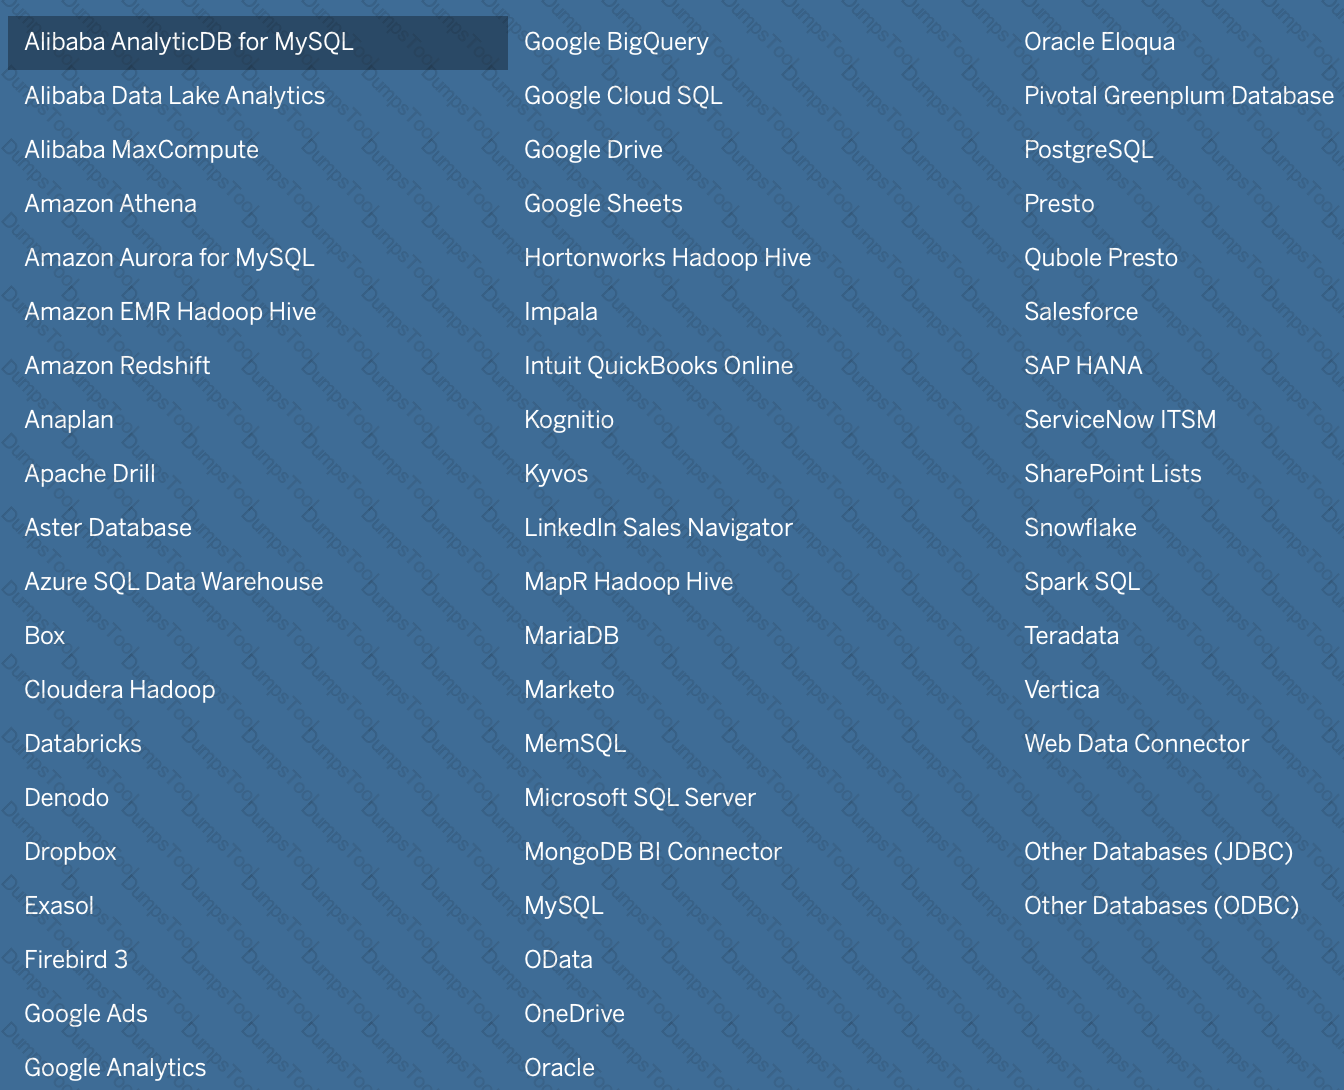
Which of the following is NOT a valid official data source in Tableau Desktop?
When creating an extract, what are three options for specifying how much data to extract? Choose three.
In order to avoid any confusions, what should you do after creating a Dual-axis chart?
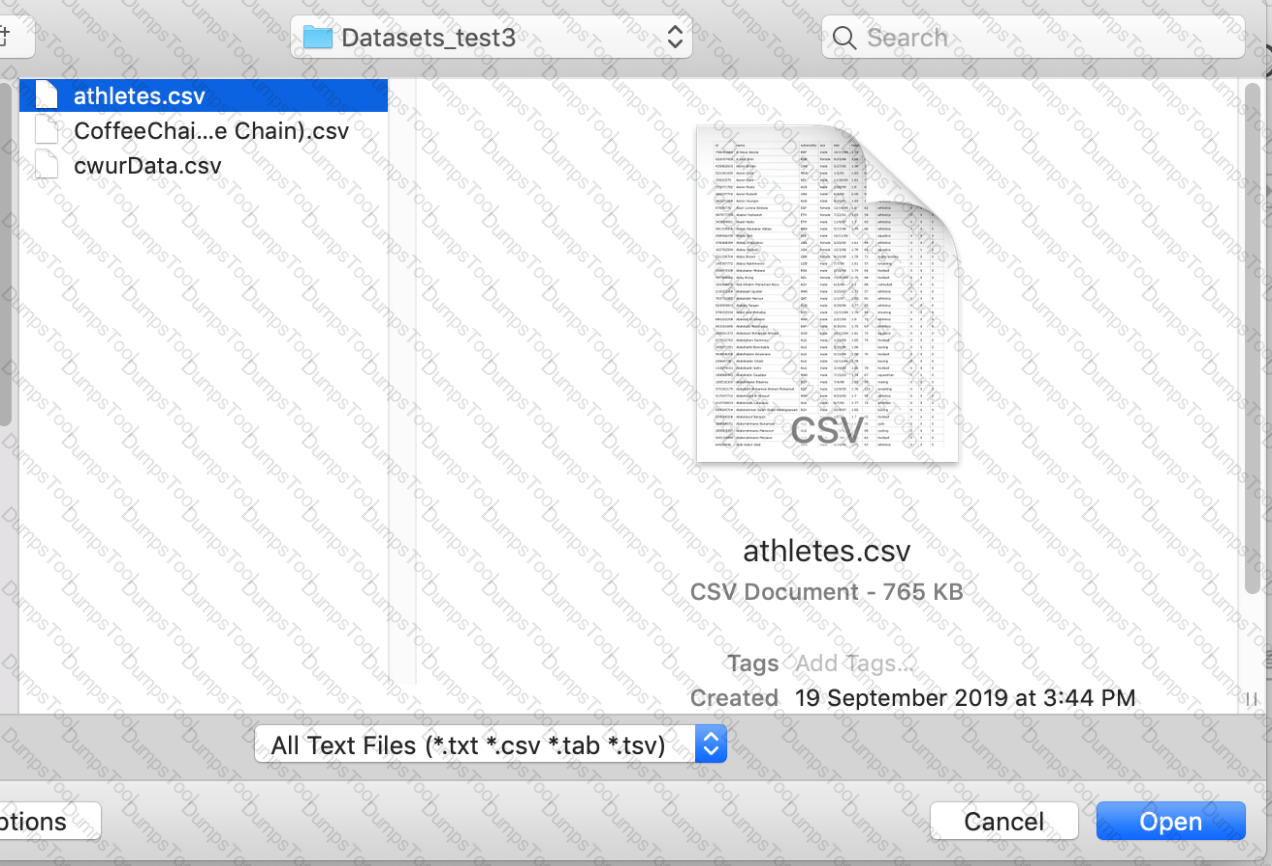
To connect Tableau to a CSV data source what type of connection should you use?
You create a crosstab that shows a list of 100 hotel chains alongside their average nightly cost. You also create two groups showing, respectively, the top 10 and bottom 10 hotel chains by cost, with subtotals.
What should you do to improve the crosstab and compare the two groups to all the remaining hotel chains?
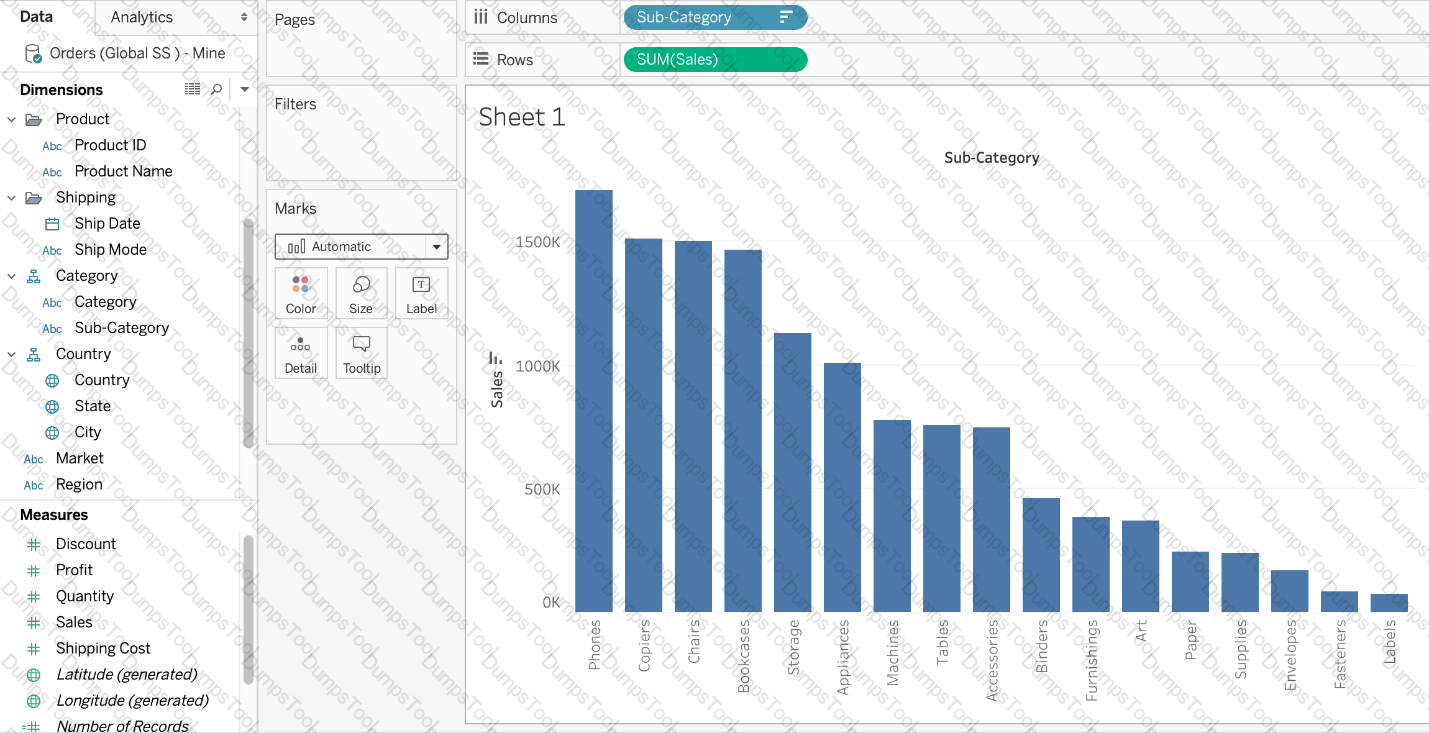
Which of the following charts types always includes bars sorted in descending order?
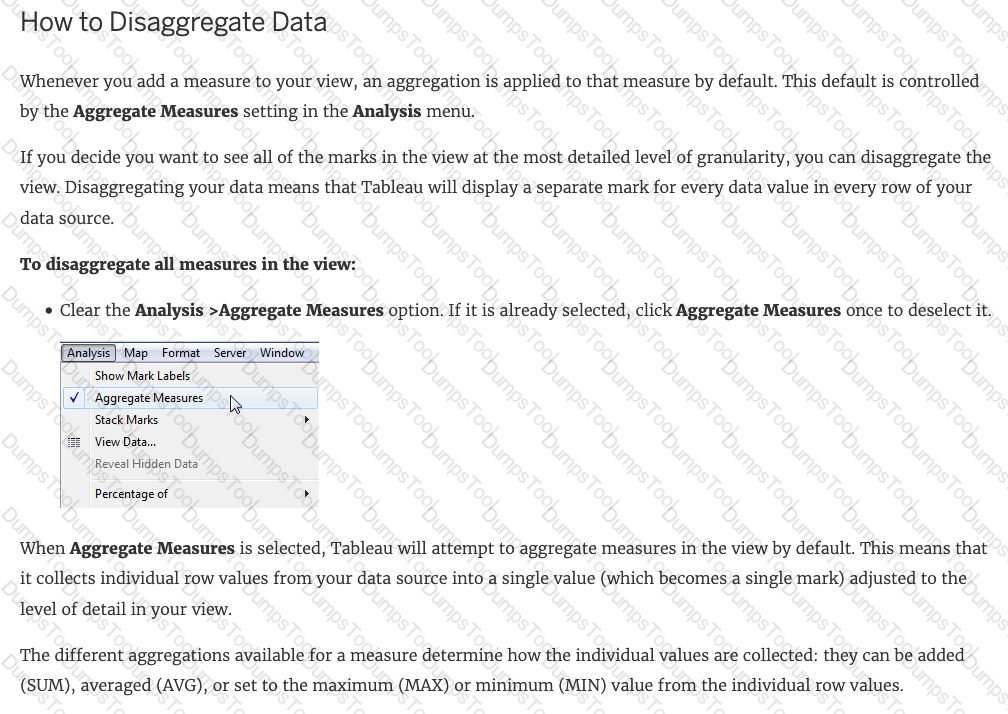
If you decide you want to see all of the marks in the view at the most detailed level of granularity, you can __________________ the view.

TESTED 28 Jul 2026
 Graphical user interface, text, application, email
Description automatically generated
Graphical user interface, text, application, email
Description automatically generated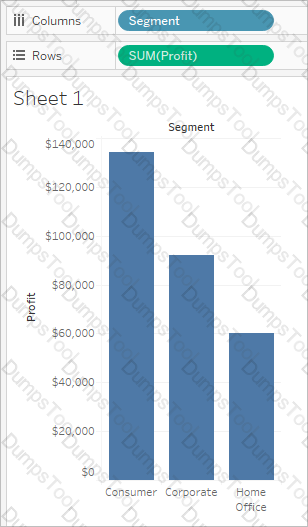
 Graphical user interface, text, application
Description automatically generated
Graphical user interface, text, application
Description automatically generated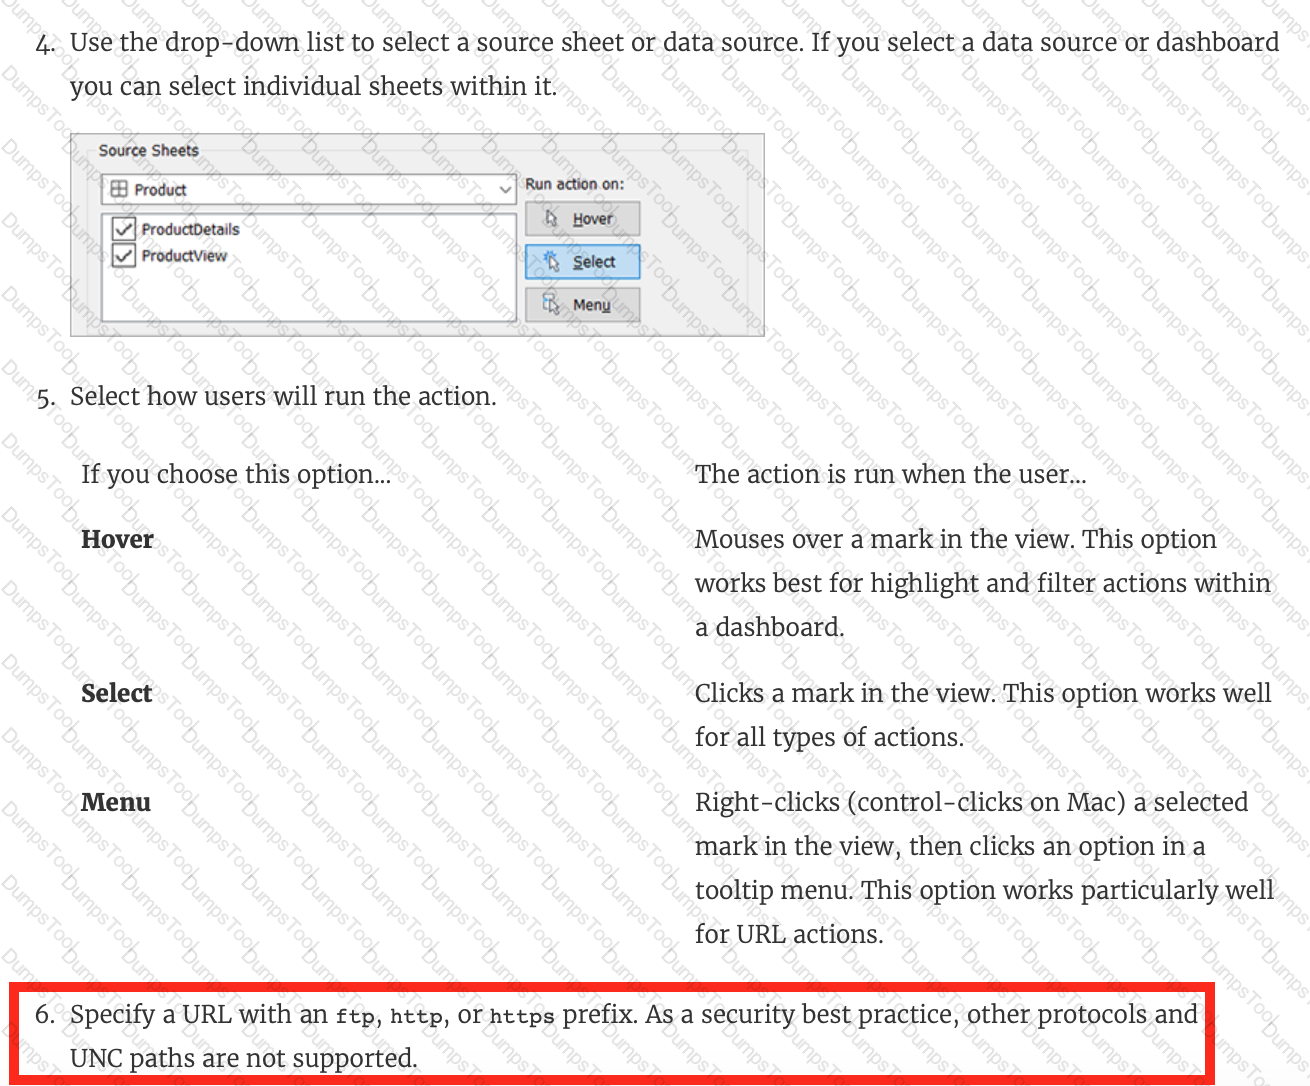 Graphical user interface, application, Word
Description automatically generated
Graphical user interface, application, Word
Description automatically generated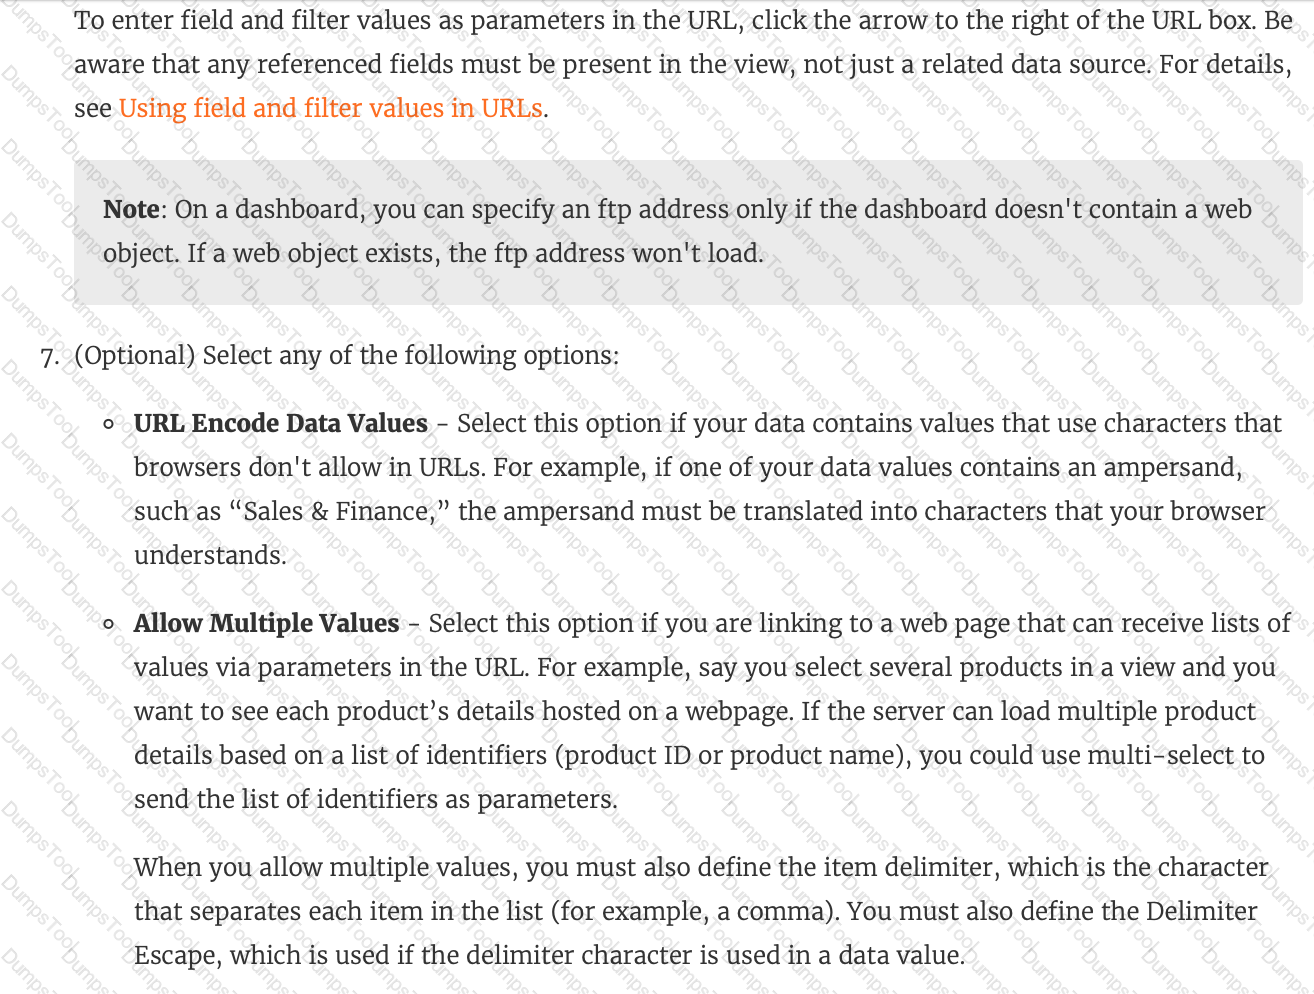 Graphical user interface, text, application
Description automatically generated
Graphical user interface, text, application
Description automatically generated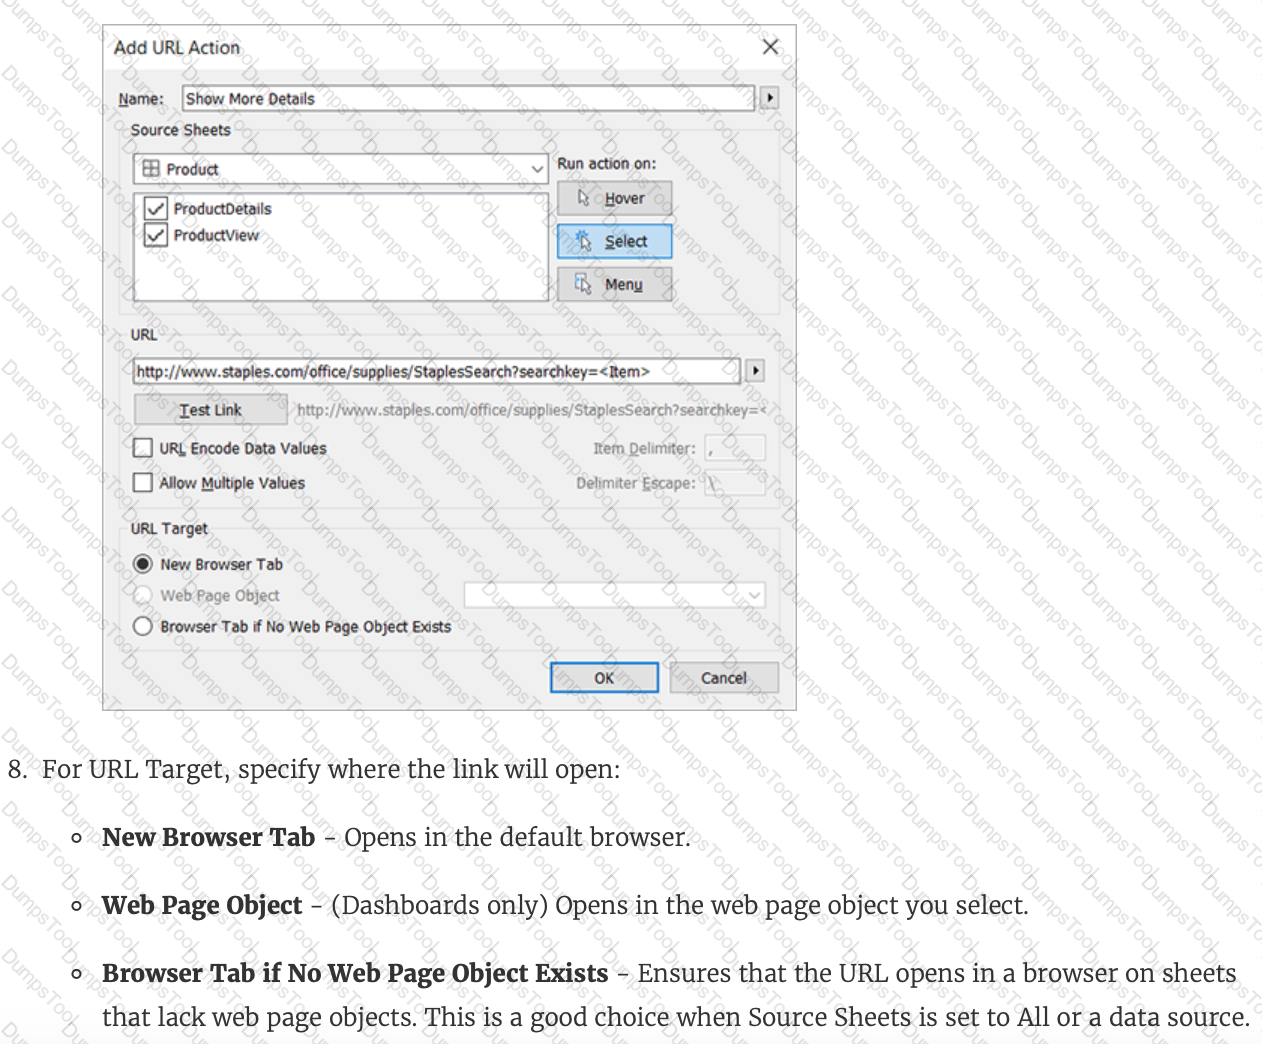 Graphical user interface, text, application
Description automatically generated
Graphical user interface, text, application
Description automatically generated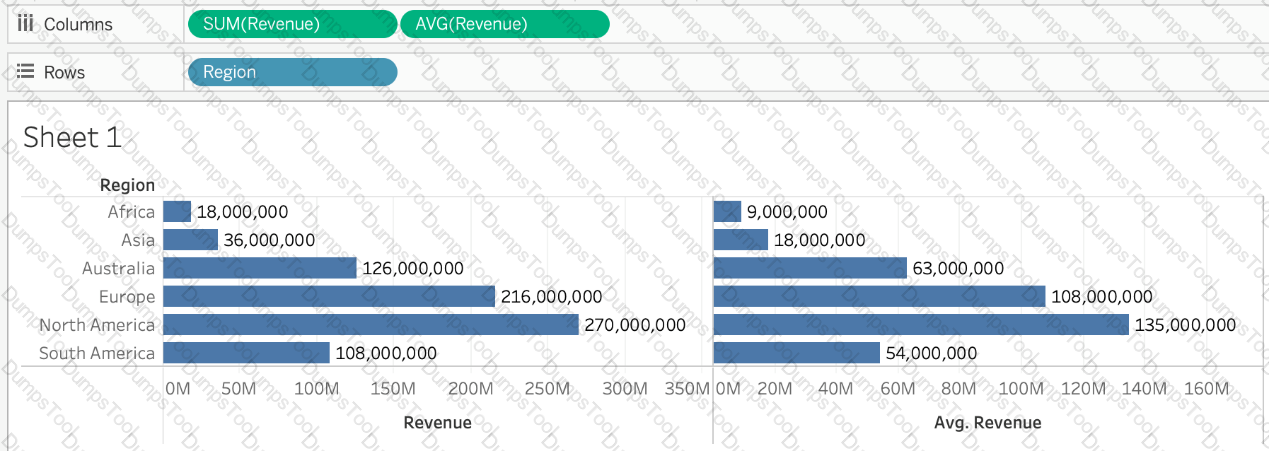
 Chart, bar chart
Description automatically generated
Chart, bar chart
Description automatically generated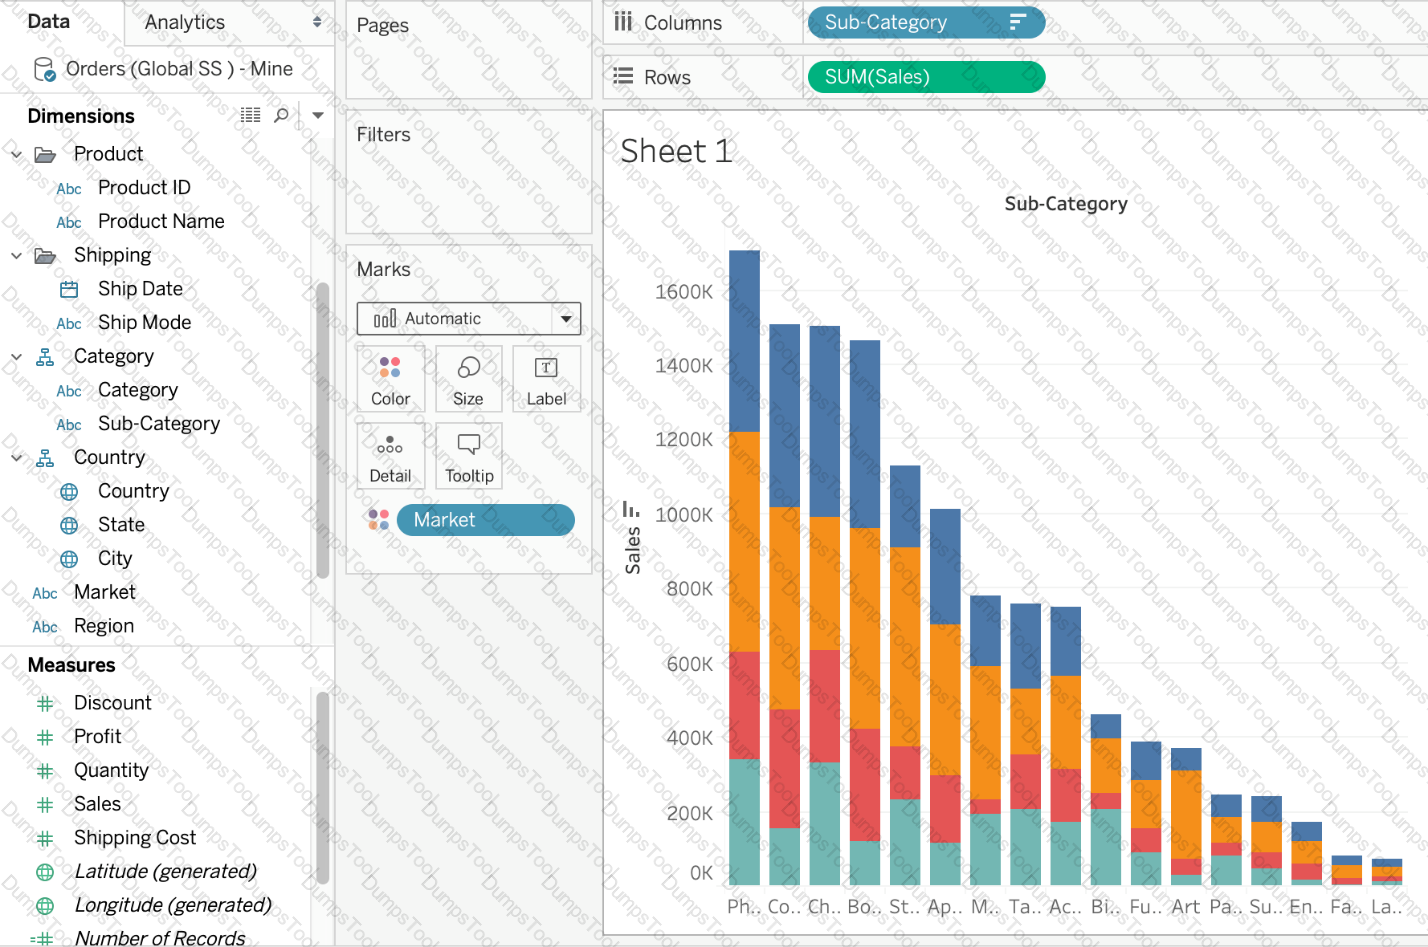 Chart, bar chart
Description automatically generated
Chart, bar chart
Description automatically generated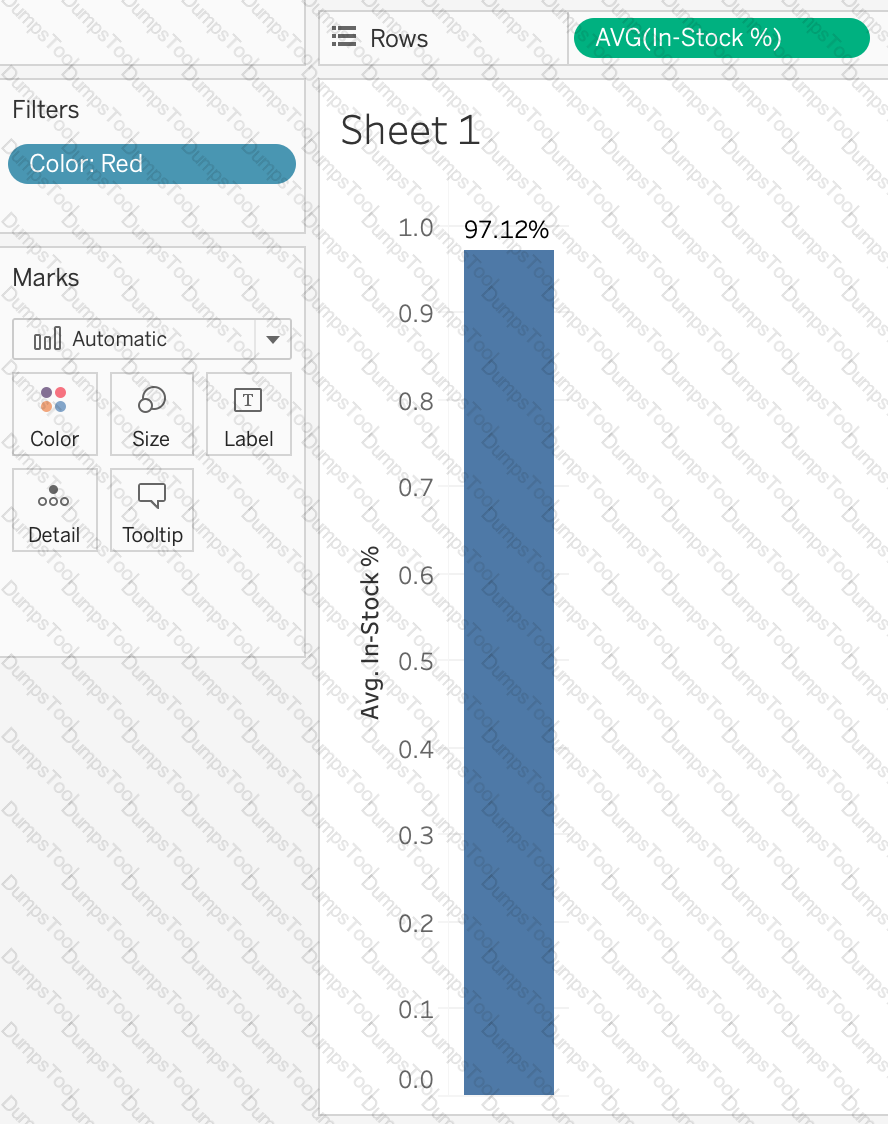
 Graphical user interface, text
Description automatically generated
Graphical user interface, text
Description automatically generated


 Chart, scatter chart
Description automatically generated
Chart, scatter chart
Description automatically generated
 Graphical user interface
Description automatically generated
Graphical user interface
Description automatically generated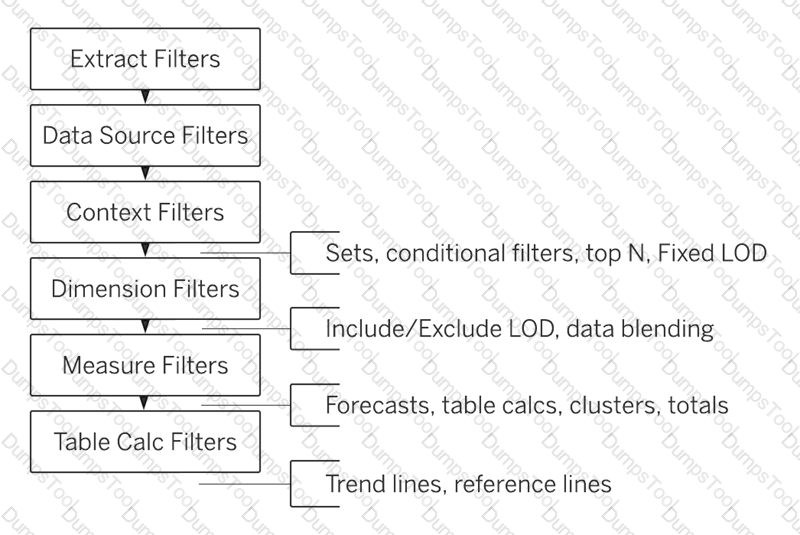 Diagram
Description automatically generated
Diagram
Description automatically generated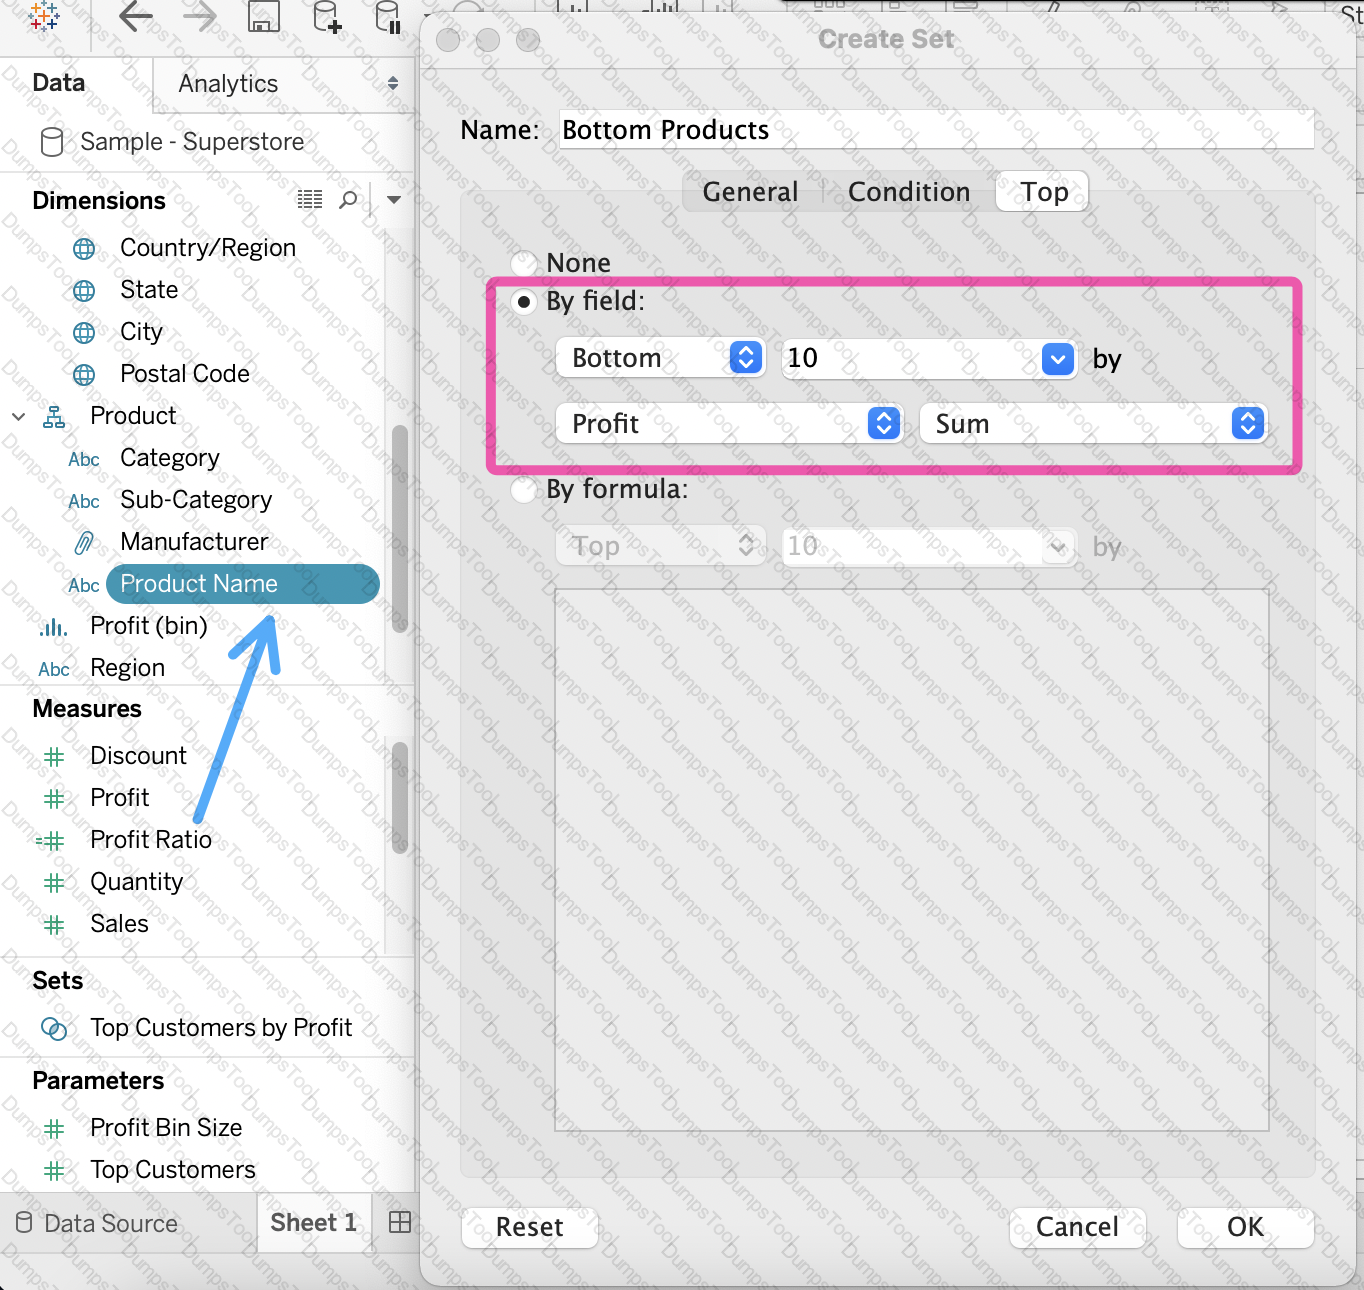


 Graphical user interface, chart, line chart
Description automatically generated
Graphical user interface, chart, line chart
Description automatically generated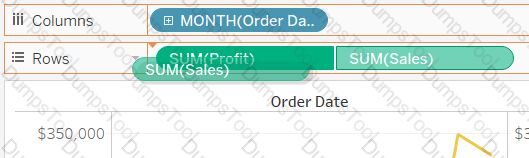 Graphical user interface, application
Description automatically generated
Graphical user interface, application
Description automatically generated