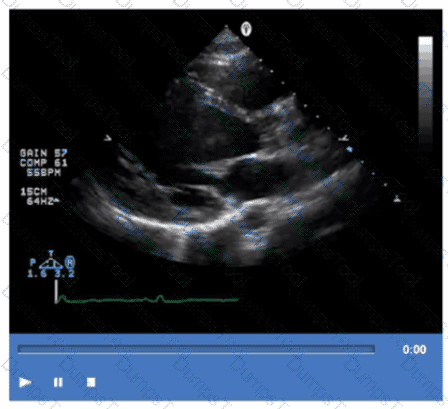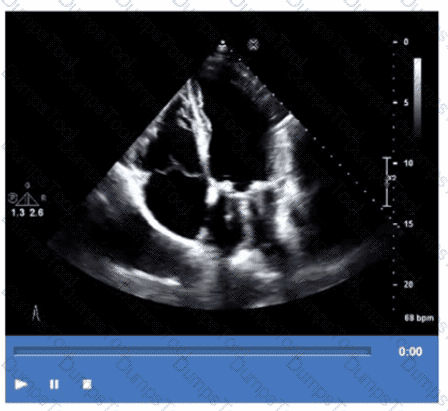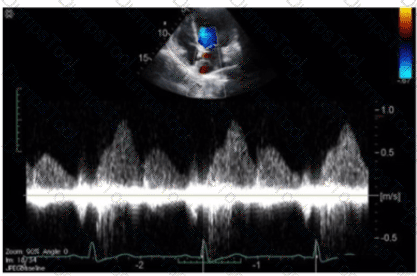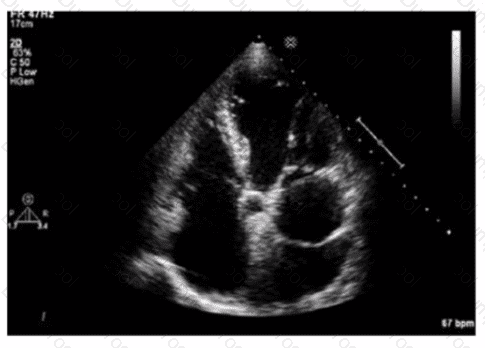
In which view is the superior vena cava visualized in its long axis?
Parasternal long axis
Apical five-chamber
Suprasternal notch
Subcostal four-chamber
Comprehensive and Detailed Explanation From Exact Extract:
The superior vena cava (SVC) is best visualized in its long axis from the suprasternal notch window. This approach provides a longitudinal view of the great vessels including the aortic arch and the SVC entering the right atrium. Other standard transthoracic echocardiographic views such as the parasternal long axis or apical views do not provide clear visualization of the SVC in its long axis. The subcostal four-chamber view typically shows the inferior vena cava but not the superior vena cava.
The suprasternal notch window is particularly useful for evaluating flow and anatomy in the SVC and the ascending aorta. This view allows clear identification of the vessel course as it enters the right atrium, making it valuable in assessment of venous return and possible pathologies involving the SVC.
This is supported in the echocardiography text under the description of transthoracic views for major venous structures and great vessels, which identifies the suprasternal notch as the best window for the long-axis visualization of the superior vena cava.
Which parameter is expected to increase in the presence of cardiac tamponade?
Heart rate
Oxygen saturation
Systolic blood pressure
Diastolic blood pressure
In cardiac tamponade, pericardial fluid accumulation restricts cardiac filling leading to decreased stroke volume and cardiac output. As a compensatory mechanism, the heart rate increases (tachycardia) to maintain cardiac output.
Oxygen saturation typically does not increase; it may be normal or decreased if tamponade leads to hypoperfusion. Systolic and diastolic blood pressures often decrease due to reduced cardiac output.
This physiological response is well described in clinical cardiology texts and ASE pericardial disease guidelines【12:ASE Pericardial Disease Guidelines†p.300-305】【16:Textbook of Clinical Echocardiography, 6e†p.280-285】
Which finding is associated with coarctation of the aorta?
Atrial septal defect
Ventricular septal defect
Left ventricular hypertrophy
Right ventricular hypertrophy
Comprehensive and Detailed Explanation From Exact Extract:
Coarctation of the aorta (CoA) causes obstruction of blood flow in the descending aorta leading to increased afterload on the left ventricle. This pressure overload results in left ventricular hypertrophy (LVH) as the heart compensates for the increased resistance.
Atrial septal defect and ventricular septal defect are separate congenital defects not necessarily associated with CoA. Right ventricular hypertrophy occurs mainly with pulmonary hypertension or right heart pressure overload.
LVH is a well-recognized echocardiographic finding in CoA and is used to assess severity and chronic effects of the lesion in adult echocardiography references and ASE congenital heart disease guidelines【16:Textbook of Clinical Echocardiography, 6e†p.550-555】【12:ASE Congenital Guidelines†p.410-420】.
What is the significance of a mitral B-bump seen on M-mode?
Elevated left atrial systolic pressure
Elevated left ventricular end-diastolic pressure
Hypertrophic obstructive cardiomyopathy
Mitral stenosis
The mitral B-bump on M-mode echocardiography represents a distinct anterior motion or thickening of the anterior mitral leaflet during atrial systole. It is associated with elevated left atrial systolic pressure.
The B-bump is a marker of increased left atrial pressure transmitted to the mitral valve, often seen in diastolic dysfunction and conditions causing elevated left atrial pressure.
It is not a direct indicator of left ventricular end-diastolic pressure, hypertrophic obstructive cardiomyopathy, or mitral stenosis.
This phenomenon is described in the "Textbook of Clinical Echocardiography, 6e", Chapter on Diastolic Function and Mitral Valve Motion【20:215-220†Textbook of Clinical Echocardiography】.
Which pathology is demonstrated in this video clip?

Amyloidosis
Sarcoidosis
Apical hypertrophic cardiomyopathy
Isolated left ventricular noncompaction
The video shows prominent trabeculations with deep intertrabecular recesses communicating with the left ventricular cavity, characteristic of isolated left ventricular noncompaction (LVNC). This congenital cardiomyopathy features a spongy myocardial appearance with thickened noncompacted layers.
Amyloidosis typically presents with thickened, bright myocardium but without prominent trabeculations. Sarcoidosis involves granulomatous inflammation, and apical hypertrophic cardiomyopathy shows localized hypertrophy without trabecular changes.
This pathology is detailed in the "Textbook of Clinical Echocardiography, 6e", Chapter on Cardiomyopathies and Myocardial Disorders【20:360-365†Textbook of Clinical Echocardiography】.
Which finding is demonstrated in this video?

Bioprosthetic valve replacement
Mechanical valve replacement
Annuloplasty ring repair
Native valve with extensive calcification
The echocardiographic video shows a prosthetic ring-like structure attached to the mitral annulus with preserved native leaflet motion, consistent with an annuloplasty ring repair. Annuloplasty rings are used to reduce the mitral annulus size and improve leaflet coaptation in mitral regurgitation without replacing the valve.
Bioprosthetic or mechanical valve replacements would show distinctly different echogenic valve structures with leaflet or disc motion replacing the native valve. Extensive calcification of a native valve appears as echogenic, thickened leaflets without a discrete ring.
This is described in the "Textbook of Clinical Echocardiography, 6e", Chapter on Mitral Valve Repair Techniques【20:400-405†Textbook of Clinical Echocardiography】.
What minimum number of poorly-visualized contiguous left ventricular (i_V) regional wall segments indicate the use of contrast agents for LV endocardial border definition?
Two
Three
Four
Five
Comprehensive and Detailed Explanation From Exact Extract:
Contrast echocardiography is recommended to enhance the visualization of left ventricular endocardial borders when the image quality is suboptimal. Specifically, contrast agents should be used when at least three contiguous left ventricular segments are poorly visualized on standard two-dimensional imaging. This approach improves the accuracy and reliability of assessing regional wall motion and global systolic function.
The use of contrast is particularly important during stress echocardiography to ensure detection of ischemic segments, which might otherwise be missed due to inadequate image quality. Studies suggest that contrast enhancement is required in approximately 30% to 50% of stress echocardiographic studies depending on patient factors and laboratory practices.
These recommendations are detailed in the echocardiography guidelines and in the "Textbook of Clinical Echocardiography, 6e" (Chapter 8: Coronary Artery Disease and Stress Echocardiography) which emphasize the utility of contrast agents for better endocardial border definition when at least three segments are not clearly seen .
Mid to distal septal akinesis in post-stress imaging of the apical four-chamber view is suggestive of disease in which coronary artery?
Posterior descending
Obtuse marginal
Left anterior descending
Left circumflex
The mid to distal interventricular septum is supplied predominantly by the left anterior descending (LAD) coronary artery. Post-stress echocardiography showing akinesis or hypokinesis of these segments is highly suggestive of ischemia or infarction in the LAD territory.
The posterior descending artery supplies the inferior wall, the obtuse marginal supplies lateral walls, and the left circumflex supplies lateral and posterior walls.
This coronary artery segmental relationship is a cornerstone of ischemic heart disease evaluation by stress echocardiography and is well documented in ASE guidelines and clinical echocardiography literature【16:Textbook of Clinical Echocardiography, 6e†p.380-385】【12:ASE Stress Echocardiography Guidelines†p.300-310】.
Which of the following conditions will increase in seventy with Valsalva maneuver?
Aortic valve stenosis
Aortic valve regurgitation
Mitral valve regurgitation
Hypertrophic obstructive cardiomyopathy
The Valsalva maneuver decreases preload and left ventricular volume, which exacerbates left ventricular outflow tract obstruction in hypertrophic obstructive cardiomyopathy (HOCM). This results in an increase in the gradient and severity of obstruction and symptoms during the maneuver.
Aortic valve stenosis, aortic regurgitation, and mitral regurgitation typically decrease or do not significantly change during Valsalva because of decreased flow and pressure.
This physiological response is detailed in the "Textbook of Clinical Echocardiography, 6e", Chapter on Dynamic Left Ventricular Outflow Obstruction and Maneuvers【20:370-375†Textbook of Clinical Echocardiography】.
During which phase of the cardiac cycle does the left ventricular filling pressure equalize with left atrial pressure?
Early rapid filling
Ventricular contraction
Atrial contraction
Diastasis
During early rapid filling, when the mitral valve opens at the onset of diastole, the pressure gradient between the left atrium (LA) and left ventricle (LV) is at its peak, allowing blood to flow into the ventricle. As filling progresses during this phase, the left ventricular diastolic pressure rises rapidly and quickly approaches and equalizes with left atrial pressure.
The equalization of pressures is critical to facilitate ventricular filling and is reflected in the mitral inflow Doppler pattern, where the E-wave corresponds to early rapid filling. Diastasis is the mid-diastolic slow filling phase where pressures are nearly equal and little flow occurs. Atrial contraction is the late filling phase, adding a small volume to the ventricle.
This physiological timing is detailed in the "Textbook of Clinical Echocardiography, 6e", Chapter on Diastolic Function and Hemodynamics, with emphasis on pressure changes during the cardiac cycle【20:210-215†Textbook of Clinical Echocardiography】.
How are pseudoaneurysms best distinguished from true aneurysms?
Pseudoaneurysms occupy the left ventricular apex.
True aneurysms are lined with myocardium.
Pseudoaneurysms have a wide neck.
True aneurysms contain thrombus.
True ventricular aneurysms are lined by scarred myocardium and have a broad neck. Pseudoaneurysms occur after myocardial rupture contained by pericardium or scar tissue and lack myocardium in the wall. Pseudoaneurysms typically have a narrow neck and are more prone to rupture.
Pseudoaneurysms can occur at various locations, not exclusively the apex. Both true aneurysms and pseudoaneurysms may contain thrombus, so this is not a distinguishing feature.
This differentiation is important clinically and is detailed in adult echocardiography and surgical cardiology texts and ASE guidelines【16:Textbook of Clinical Echocardiography, 6e†p.400-405】【12:ASE Cardiac Masses and Aneurysms Guidelines†p.150-160】.
Which region of the aorta is being measured to assess the critical finding in this image?
Sinus of Valsalva
Descending aorta
Aortic root
Ascending aorta
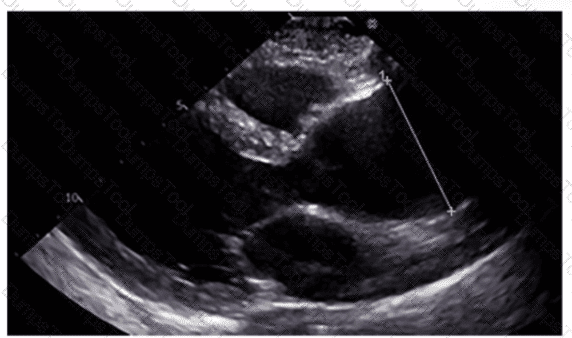
The echocardiographic image shows measurement of the ascending aorta, identified by its position above the aortic valve and before the arch vessels. The ascending aorta is a critical region assessed for dilation or aneurysm.
The sinus of Valsalva refers to the dilated portion just above the aortic valve cusps, while the aortic root includes the annulus, sinuses, and sinotubular junction. The descending aorta is posterior and visualized in other windows.
This measurement and its importance are detailed in the "Textbook of Clinical Echocardiography, 6e", Chapter on Aortic Root and Ascending Aorta Evaluation【20:380-385†Textbook of Clinical Echocardiography】.
Which of the following does this Image represent?

Mitral valve inflow
Tricuspid valve inflow
Hepatic vein Doppler
Pulmonary vein Doppler
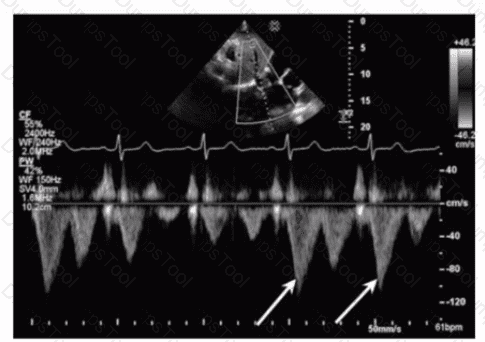
Comprehensive and Detailed Explanation From Exact Extract:
The image shows a pulsed-wave Doppler waveform with respiratory phasicity and distinct forward and reversed flow components characteristic of hepatic vein flow patterns. Hepatic vein Doppler typically displays a biphasic waveform with systolic (S) and diastolic (D) forward flow toward the heart and brief reversed flow during atrial contraction (A wave reversal), reflecting right atrial pressure changes.
Mitral and tricuspid inflow Doppler patterns show distinct E and A waves representing early and late diastolic ventricular filling but do not have the same flow reversal pattern. Pulmonary vein Doppler waveforms also differ, showing systolic and diastolic forward flows into the left atrium without the prominent reversed flow seen here.
The hepatic vein Doppler is commonly used in echocardiography to assess right atrial pressure and compliance, especially in conditions like constrictive pericarditis and right heart failure, where characteristic flow reversals and expiratory changes are observed.
This pattern and its clinical significance are detailed in adult echocardiography references, including the "Textbook of Clinical Echocardiography" and ASE guidelines on Doppler imaging【16:Hepatic Vein Doppler†Textbook of Clinical Echocardiography, 6e】【12:ASE Doppler Guidelines†p.95-100】.
Which type of mass is typically attached to the fossa ovalis of the left atrium?
Myxoma
Fibroelastoma
Sarcoma
Lipoma
Atrial myxomas are the most common primary cardiac tumors in adults and are typically attached to the interatrial septum at the fossa ovalis region of the left atrium. These tumors often arise from a stalk and are mobile masses that may cause obstruction of the mitral valve or embolic events.
The echocardiographic hallmark of atrial myxoma is a well-circumscribed, pedunculated mass attached near the fossa ovalis. Transesophageal echocardiography (TEE) is especially useful in visualizing the attachment site and mobility of the myxoma.
Other cardiac masses have different typical locations: papillary fibroelastomas usually arise from valvular surfaces (often aortic or mitral valves), sarcomas are rare malignant tumors that can invade multiple areas, and lipomas usually involve the atrial septum but spare the fossa ovalis and have a characteristic echogenic appearance.
The "Textbook of Clinical Echocardiography" describes atrial myxomas as mobile masses attached to the fossa ovalis in the left atrium and emphasizes their characteristic appearance on TEE imaging, which is critical for diagnosis and surgical planning.
Which finding is most consistent with this M-mode image?
Rheumatic mitral stenosis
Mitral valve prolapse
Mitral valve annuloplasty ring
Systolic antenor motion of the mitral valve
Comprehensive and Detailed Explanation From Exact Extract:
This M-mode echocardiographic image shows thickened mitral valve leaflets with a characteristic "doming" or "hockey-stick" appearance during diastole, which is classic for rheumatic mitral stenosis. Rheumatic mitral stenosis leads to leaflet thickening, restricted opening, and calcification, which alters the normal mitral valve motion on M-mode.
Mitral valve prolapse would show systolic displacement of the leaflets into the left atrium, typically later in systole, not doming in diastole. Mitral valve annuloplasty ring would appear as a bright echogenic line around the annulus but is not seen in this image. Systolic anterior motion (SAM) of the mitral valve is usually seen in hypertrophic cardiomyopathy and presents as anterior motion during systole, not the diastolic pattern shown.
This classical M-mode appearance is described in "Textbook of Clinical Echocardiography, 6e", Chapter on Rheumatic Valve Disease【20:385-390†Textbook of Clinical Echocardiography】.
Which finding is shown in this image?

Chiari network
Left atrial thrombus
Cor triatriatum
Artifact
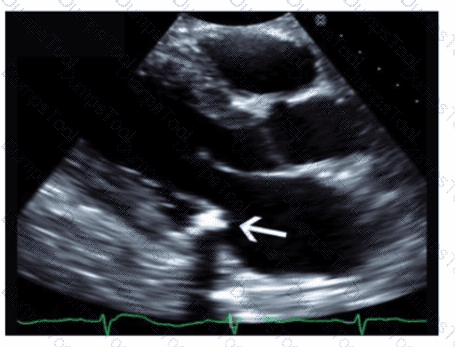
The echocardiographic image shows a mobile, highly echogenic, mesh-like structure within the right atrium consistent with the Chiari network. The Chiari network is an embryologic remnant of the right valve of the sinus venosus, appearing as a fenestrated, reticulated membrane that is usually thin and mobile, found near the orifice of the inferior vena cava or the coronary sinus.
This structure is benign and often an incidental finding but can be confused with thrombus or atrial tumors. Unlike left atrial thrombus, which appears as a more solid, immobile mass often located in the left atrial appendage, the Chiari network is mobile and located in the right atrium. Cor triatriatum is a rare congenital membrane dividing the left atrium into two chambers and appears differently on echocardiography. Artifact refers to non-anatomic echoes which do not persist or move consistently.
Recognition of Chiari network is important to avoid misdiagnosis, and its characteristics are well described in echocardiography literature such as the "Textbook of Clinical Echocardiography" and ASE imaging guidelines【16:Textbook of Clinical Echocardiography, 6e†p.400-402】【12:ASE Guidelines on Cardiac Masses†p.150-155】.
Which statement is considered true regarding tricuspid annular plane systolic excursion (TAPSE)?
It is a measure of right ventricular diastolic function.
It is an indirect measure of left ventricular systolic function.
It is angle dependent.
The lower reference value is 13 mm.
TAPSE measures the longitudinal systolic excursion of the tricuspid annulus towards the apex and is a widely used echocardiographic parameter of right ventricular systolic function. It is not a measure of diastolic function nor an indirect measure of left ventricular function.
TAPSE is relatively angle independent because it is measured in M-mode from the apical four-chamber view aligned with annular motion.
The lower normal limit for TAPSE is generally accepted as 16 mm, but 13 mm is sometimes cited as a threshold below which right ventricular systolic dysfunction is suggested.
This information is presented in the "Textbook of Clinical Echocardiography, 6e", Chapter on Right Ventricular Function Assessment【20:320-325†Textbook of Clinical Echocardiography
Which of the following can be calculated from the peak tricuspid regurgitant velocity?
Right atrial pressure
Pulmonary artery diastolic pressure
Mean pulmonary artery pressure
Right ventricular systolic pressure
Peak tricuspid regurgitant velocity (TRV) allows estimation of right ventricular systolic pressure (RVSP) using the simplified Bernoulli equation: RVSP = 4 × (TRV)^2 + estimated right atrial pressure.
This measurement is important for assessing pulmonary hypertension indirectly.
Right atrial pressure is estimated separately, pulmonary artery diastolic pressure and mean pressure require additional measurements.
This application is discussed in the "Textbook of Clinical Echocardiography, 6e", Chapter on Right Heart Pressure Estimation【20:335-340†Textbook of Clinical Echocardiography】.
Which wall is indicated by the arrow on this image?
Anterior
Inferior
Anterolateral
Inferolateral
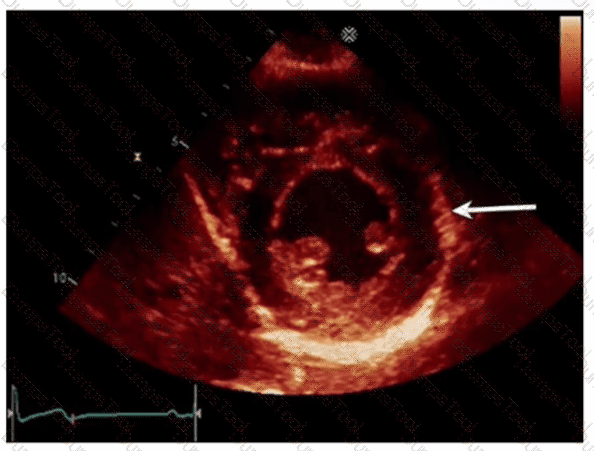
The echocardiographic image is a parasternal long axis or apical view showing the left ventricle. The arrow points to the wall segment located inferiorly, corresponding to the inferior wall of the left ventricle. The inferior wall is typically visualized in parasternal long axis and apical views as the posterior aspect of the ventricle.
Other options correspond to different walls: anterior is anterior septal wall, anterolateral and inferolateral refer to the lateral wall regions. Accurate wall identification is critical for regional wall motion analysis and coronary artery territory correlation.
This segmental wall identification is detailed in adult echocardiography and ASE chamber quantification guidelines【12:ASE Chamber Quantification Guidelines†p.90-95】【16:Textbook of Clinical Echocardiography, 6e†p.140-145】.
Which condition is most likely demonstrated by this M-mode image?

Dilated cardiomyopathy
Hypertrophic cardiomyopathy
Mitral valve prolapse
Mitral stenosis
The M-mode image shows characteristic diastolic doming or “hockey stick” appearance of the anterior mitral leaflet with restricted leaflet motion. This is a classic sign of mitral stenosis, where leaflet thickening and fusion cause limited opening during diastole.
Dilated cardiomyopathy shows increased chamber sizes and decreased systolic function but not mitral leaflet doming. Hypertrophic cardiomyopathy is characterized by septal thickening and SAM of the mitral valve. Mitral valve prolapse shows leaflet billowing into the left atrium during systole.
This pattern is well described in ASE valvular heart disease guidelines and echocardiography texts【12:ASE Valve Imaging Guidelines†p.180-185】【16:Textbook of Clinical Echocardiography, 6e†p.200-205】.
Which finding does peak mitral valve regurgitant Doppler velocity reflect?
Severity of regurgitation
Pressure gradient between the left ventricle and aorta
Mechanism of regurgitation
Pressure gradient between the left ventricle and left atrium
The peak Doppler velocity of mitral regurgitation (MR) reflects the instantaneous pressure gradient between the left ventricle (LV) and left atrium (LA) during systole. The higher the velocity, the greater the pressure difference.
However, the velocity itself does not quantify severity directly; severity depends on the size and volume of the regurgitant jet. The mechanism is determined by valve morphology and motion, not velocity. The LV to aorta gradient relates to aortic valve pathology.
This principle is discussed in the "Textbook of Clinical Echocardiography, 6e", Chapter on Mitral Regurgitation and Doppler Evaluation【20:390-395†Textbook of Clinical Echocardiography】.
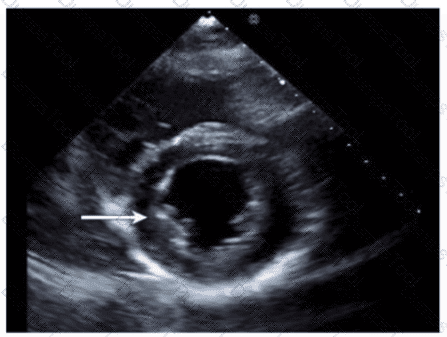
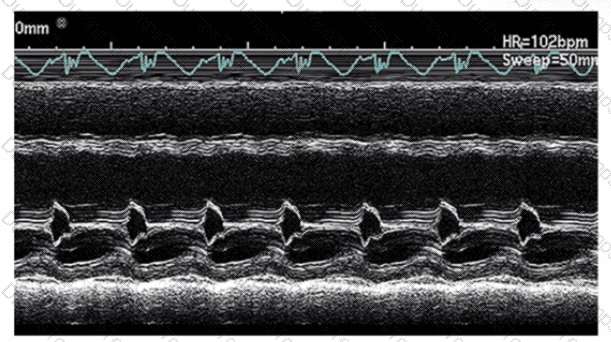
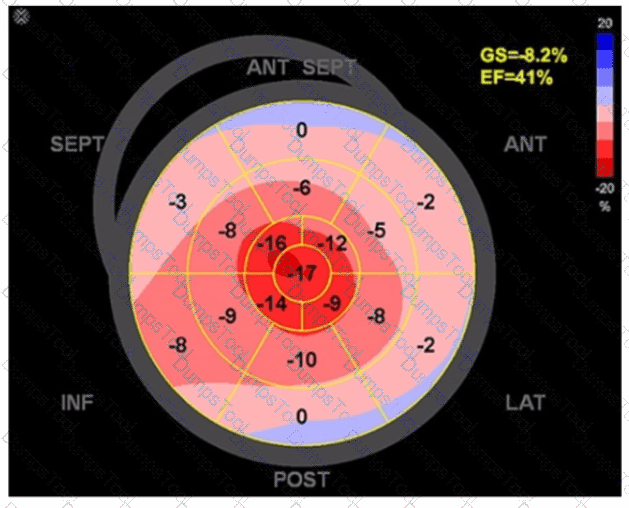
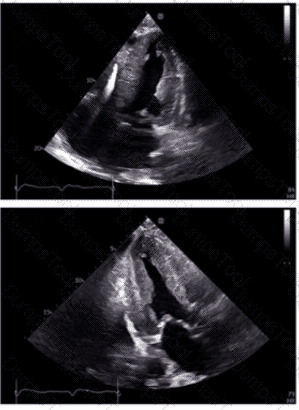
Which diagnosis is most consistent with the findings in these images?


Takotsubo cardiomyopathy
Apical hypertrophic cardiomyopathy
Hypertrophic obstructive cardiomyopathy
Restrictive cardiomyopathy from amyloidosis
The first image shows a bullseye plot of global longitudinal strain (GLS) with marked reduction in strain values (less negative numbers) most prominently in the apical segments (central red zone), with an overall GLS of -8.2% (normal is about -20%) and a reduced ejection fraction of 41%. This pattern is characteristic of Takotsubo cardiomyopathy, which typically demonstrates regional wall motion abnormalities that predominantly involve the apex and mid segments of the left ventricle with basal sparing.
The 2D echocardiographic images show apical ballooning, a hallmark of Takotsubo cardiomyopathy, where the apex is akinetic or dyskinetic and the basal segments contract normally or hypercontract. Doppler images show findings consistent with impaired ventricular function.
In contrast:
Apical hypertrophic cardiomyopathy (HCM) would show increased wall thickness localized to the apex but not apical ballooning or reduced strain in that typical pattern.
Hypertrophic obstructive cardiomyopathy (HOCM) involves basal septal hypertrophy with outflow obstruction, not apical akinesis or ballooning.
Restrictive cardiomyopathy from amyloidosis involves diffuse infiltration and generally a different strain pattern with more uniform reduction and “apical sparing” rather than apical involvement.
This interpretation aligns with the diagnostic criteria and echocardiographic features described in the adult echocardiography literature, including the "Textbook of Clinical Echocardiography" (Chapter on Cardiomyopathies) and ASE guidelines, which highlight apical ballooning and regional strain abnormalities as diagnostic features of Takotsubo cardiomyopathy【16:Cardiomyopathy Chapter†Textbook of Clinical Echocardiography, 6e】【12:ASE Guidelines on Strain Imaging†p.130-135】.
Which kind of cardiac valve is a heterograft?
One that is from a human to another human
One that is from pericardial tissue
One that is from one location to another in the same human
One that is from an animal to a human
A heterograft (also called xenograft) cardiac valve is derived from an animal species, commonly porcine or bovine, and implanted into a human. These bioprosthetic valves are treated to reduce immunogenicity.
Option A describes an allograft (homograft). Option B refers to bioprosthetic valves but does not specify species. Option C describes an autograft, such as the Ross procedure.
This classification is standard in cardiac surgery and echocardiography literature【16:Textbook of Clinical Echocardiography, 6e†p.450-455】【12:ASE Valve Prosthesis Guidelines†p.200-205】.
Which left ventricular regional wall segment is indicated by the arrow on this image?

Anterior
Anterolateral
Inferior
Inferolateral
Comprehensive and Detailed Explanation From Exact Extract:
The echocardiographic image shows a short-axis view of the left ventricle at the mid-papillary muscle level with segmental strain values. The arrow points to the wall segment located inferiorly (towards the bottom of the image in standard orientation), which corresponds to the inferior wall of the left ventricle.
According to the standardized 17-segment model endorsed by the American Society of Echocardiography (ASE), the inferior wall is situated posteriorly and inferiorly in the short-axis view. The other options represent adjacent walls: anterior is opposite the inferior wall, anterolateral and inferolateral correspond to lateral wall segments.
This segmental anatomy and nomenclature are detailed in adult echocardiography textbooks and ASE chamber quantification guidelines, which emphasize precise segmental identification for accurate regional function assessment【12:ASE Chamber Quantification Guidelines†p.90-95】【16:Textbook of Clinical Echocardiography, 6e†p.140-145】.
What is the incidental finding seen by color Doppler in this four-chamber view of a patient with left atrial enlargement?
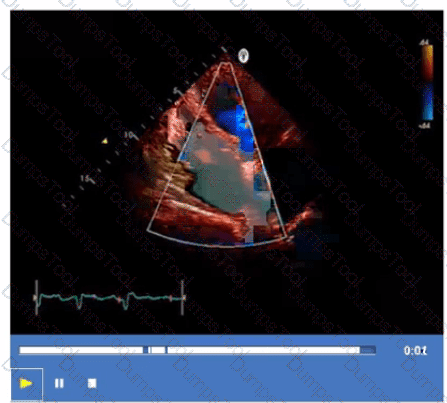
Muscular ventricular septal defect
Coronary-cameral fistula
Patent foramen ovale
Sinus venosus defect
The color Doppler image in the four-chamber view shows a jet across the interatrial septum, indicating a shunt at the atrial level. In a patient with left atrial enlargement, the most common incidental finding causing such flow is a patent foramen ovale (PFO). A PFO is a small communication between the right and left atria that can open under certain pressure conditions, leading to shunting.
Muscular ventricular septal defect is a ventricular level defect and would be seen in different views. Coronary-cameral fistula is a rare anomaly involving abnormal connections between coronary arteries and cardiac chambers, not typical in this setting. Sinus venosus defect is an atypical atrial septal defect located near the superior vena cava and would require different imaging planes for detection.
This finding and its implications are discussed in the "Textbook of Clinical Echocardiography, 6e", Chapter on Atrial Septal Defects and Shunts【20:115-120†Textbook of Clinical Echocardiography】.
In cardiac tamponade, how do transvalvular pressure gradients change during expiration?
Transmitral decreases and transtricuspid increases
Transmitral increases and transtricuspid increases
Transmitral increases and transtricuspid decreases
Transmitral decreases and transtricuspid decreases
In cardiac tamponade, there is a characteristic reciprocal respiratory variation in transvalvular flow velocities due to ventricular interdependence and impaired cardiac filling. During expiration, the intrathoracic pressure increases, which leads to decreased right ventricular filling and thus decreased transtricuspid flow velocity. Simultaneously, left ventricular filling increases, causing an increase in transmitral flow velocity.
Therefore, during expiration, the transmitral gradient increases while the transtricuspid gradient decreases. This phenomenon reverses during inspiration, where transtricuspid flow increases and transmitral flow decreases. These respiratory variations are diagnostic hallmarks of tamponade physiology and help distinguish it from other conditions.
This principle is illustrated in Doppler echocardiographic studies of ventricular inflow and is described with diagrams in the "Textbook of Clinical Echocardiography, 6e" (Chapter 10: Pericardial Disease), highlighting the changes in transmitral and transtricuspid velocities during the respiratory cycle in tamponade .
Which echogenic structure is indicated by the arrow on this image?

Vegetation
Tumor
Thrombus
Annular calcification
The image is a parasternal long-axis echocardiographic view focusing on the mitral valve annulus with a highly echogenic, dense, and well-defined structure located at the base of the posterior mitral leaflet. This appearance is characteristic of mitral annular calcification (MAC), a degenerative process resulting in calcium deposition along the mitral valve annulus.
Vegetations appear as irregular, mobile masses attached to valve leaflets and are less dense. Tumors and thrombi have different echogenicity and locations (tumors often in atria, thrombi in atrial appendages). MAC is usually more echogenic and localized to the annulus.
This description and differentiation are found in adult echocardiography textbooks and ASE guidelines on cardiac masses and valvular calcifications【16:Textbook of Clinical Echocardiography, 6e†p.460-465】【12:ASE Guidelines on Cardiac Masses†p.150-160】.
A patient presents with tender, red lesions on their fingers and toes (Osier nodes). Which finding is most likely?
Carcinoid heart disease
Lambl excrescences
Papillary fibroelastoma
Infective endocarditis
Osler nodes are tender, erythematous nodules typically located on the fingers and toes, and are a classic sign of infective endocarditis (IE). They represent immune complex deposition and microemboli causing localized vasculitis.
Carcinoid heart disease presents with right-sided valve fibrosis and not with Osler nodes. Lambl excrescences are small filiform valvular strands without clinical manifestations such as Osler nodes. Papillary fibroelastomas are benign cardiac tumors that may cause emboli but not immune-mediated skin lesions.
This classic clinical sign and its echocardiographic correlation in IE are discussed in the "Textbook of Clinical Echocardiography, 6e", Chapter on Infective Endocarditis【20:400-405†Textbook of Clinical Echocardiography】.
Which method of measuring left atrial size is most recommended and most accurate?
3D imaging and volume calculations
Linear dimension in the anteroposterior plane
Area by planimetry, indexed to body surface area
Biplane disk summation, indexed to body surface area
Comprehensive and Detailed Explanation From Exact Extract:
Biplane disk summation (Simpson’s method) of left atrial (LA) volume, indexed to body surface area, is the most accurate and recommended method for assessing LA size. This method accounts for the asymmetrical shape of the LA and provides reproducible volume measurements.
3D imaging can provide even more precise volume data but is less widely available and less standardized. Linear dimension and planimetry are less accurate because they do not fully represent LA size.
ASE chamber quantification guidelines strongly recommend biplane volume measurement for LA size assessment in clinical practice【12:ASE Chamber Quantification Guidelines†p.90-95】【16:Textbook of Clinical Echocardiography, 6e†p.120-125】.
Which condition is most plausible based on the finding indicated by the arrow on this image?
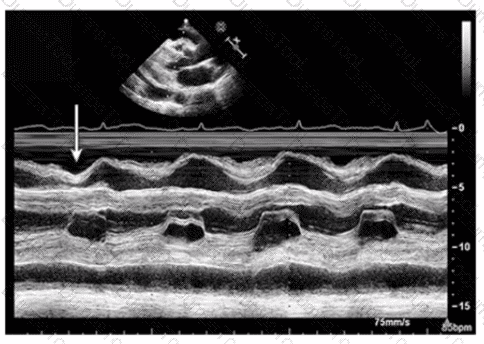
Cardiac tamponade
Constrictive pericarditis
Pulmonary embolism
Pulmonary hypertension
The image is a parasternal long axis M-mode echocardiographic tracing demonstrating the interventricular septum and posterior left ventricular wall. The arrow points to the septal “bounce” or “shudder,” which is an abnormal early diastolic septal motion.
This septal bounce is a classic echocardiographic finding in constrictive pericarditis, caused by rapid early diastolic filling with abrupt cessation due to pericardial constraint, resulting in paradoxical septal motion.
Cardiac tamponade usually shows pericardial effusion with chamber collapse but not septal bounce. Pulmonary embolism and pulmonary hypertension have different echocardiographic signs such as right ventricular dilatation and pressure overload but no septal bounce.
These features are well described in the "Textbook of Clinical Echocardiography" and ASE pericardial disease guidelines【16:Textbook of Clinical Echocardiography, 6e†p.280-285】【12:ASE Pericardial Disease Guidelines†p.300-305】.
Which view best demonstrates a wall thickening abnormality of the apical lateral segment?
Two-chamber
Four-chamber
Parasternal long axis
Mid-parastemal short axis
The two-chamber apical view allows visualization of the left ventricle's anterior and inferior walls, including the apical lateral segment. It is ideal for assessing wall thickness and segmental wall motion abnormalities in this region.
The four-chamber view visualizes septal and lateral walls but does not optimally display the apical lateral segment. Parasternal long axis primarily visualizes the anterior septum and posterior wall but is limited for lateral apex. The mid-parasternal short axis focuses on mid-ventricular segments and does not visualize the apex.
This anatomical and echocardiographic detail is described in the "Textbook of Clinical Echocardiography, 6e", Chapter on Left Ventricular Segmental Analysis【20:120-125†Textbook of Clinical Echocardiography】.
The 'P' wave of an electrocardiogram relates to which echocardiography event?
Atrial contraction
Ventricular contraction
Atrial relaxation
Ventricular diastole
Comprehensive and Detailed Explanation From Exact Extract:
The P wave on the ECG corresponds to atrial depolarization, which precedes atrial contraction (atrial systole). On echocardiography, atrial contraction can be observed as the atrial "kick," contributing to ventricular filling during late diastole.
Ventricular contraction (QRS complex) and ventricular relaxation (T wave) correspond to other phases of the cardiac cycle. Atrial relaxation occurs during ventricular systole but is not represented by the P wave.
This timing relationship is critical for correlating echocardiographic Doppler inflow patterns, such as the late diastolic A wave, with the ECG. These concepts are outlined in the foundational echocardiography references, including ASE guidelines and the "Textbook of Clinical Echocardiography"【16:Textbook of Clinical Echocardiography, 6e†p.150-155】【12:ASE Echocardiography Guidelines†p.50-55】.
Which view is best for assessing atrial situs in the presence of congenital heart disease?

Subcostal
Short axis
Long axis
Suprasternal notch
The subcostal view is the preferred transthoracic echocardiographic window to assess atrial situs, especially in congenital heart disease. This view provides a cross-sectional look at the abdominal organs and atrial chambers, helping determine the relative position of the inferior vena cava and aorta, which aids in defining atrial situs (solitus, inversus, or ambiguous).
Short axis and long axis views provide excellent cardiac anatomy but are less informative for visceral situs. The suprasternal notch window is mainly used to visualize the great vessels but does not provide adequate assessment of atrial situs.
The subcostal view's ability to demonstrate abdominal situs and systemic venous return makes it essential in congenital cardiac evaluations and is recommended in echocardiography protocols for congenital heart disease assessment .
Which of the following is a feature of constrictive pericarditis?
Mitral inflow pattern has a large E-wave and a small A-wave without respiratory changes
Normal hepatic vein size
Dilated inferior vena cava with inspiratory collapse during sniff test
Interventricular septal bounce
Comprehensive and Detailed Explanation From Exact Extract:
Constrictive pericarditis is characterized by thickening and fibrosis of the pericardium which restricts diastolic filling of the ventricles. Key echocardiographic features include a characteristic interventricular septal "bounce" or shift during early diastole due to the abrupt cessation of ventricular filling imposed by the rigid pericardium. This septal bounce reflects rapid early diastolic filling followed by a sudden halt as filling pressures equalize, a hallmark of constriction physiology.
Additionally, Doppler studies show marked respiratory variation in mitral and tricuspid inflow velocities (>25%), with an inspiratory increase in tricuspid inflow and a decrease in mitral inflow velocity, reflecting ventricular interdependence caused by the noncompliant pericardium. The mitral inflow typically shows a large E-wave with a small or absent A-wave and a steep deceleration slope, but importantly these velocities vary significantly with respiration, which is not the case in restrictive cardiomyopathy.
Hepatic vein Doppler often reveals a prominent a-wave and a deep y-descent with increased diastolic flow reversal during expiration, indicating elevated right atrial pressures and constrictive physiology.
The inferior vena cava (IVC) is usually dilated and shows no inspiratory collapse (i.e., no normal collapse with sniff test) because of elevated right atrial pressure and impaired venous return.
Therefore:
Option A is incorrect because mitral inflow in constrictive pericarditis shows significant respiratory variation, not absence of it.
Option B is incorrect because the hepatic vein is typically dilated with abnormal flow patterns, not normal size.
Option C is incorrect because the IVC is dilated and does NOT collapse normally with inspiration/sniff in constrictive pericarditis.
Option D is correct because the interventricular septal bounce is a classic feature reflecting ventricular interdependence and constrictive physiology.
These findings are summarized in the "Textbook of Clinical Echocardiography, 6e" (Catherine M. Otto, MD), Chapter 10 (Pericardial Disease), pages 280–285, with key illustrations showing septal bounce, Doppler inflow variations, hepatic vein flow patterns, and IVC findings in constrictive pericarditis. The "Mayo Clinic criteria" for echocardiographic diagnosis also emphasize ventricular septal shift as a critical feature, often combined with tissue Doppler annular velocity patterns and hepatic vein diastolic flow reversal for high diagnostic accuracy.
Which abnormality is associated with Marfan syndrome?
Aortic annular dilatation
Coarctation of the aorta
Parachute mitral valve
Cleft mitral valve
Marfan syndrome is a connective tissue disorder characterized by abnormalities in the fibrillin-1 gene, leading to cardiovascular manifestations including aortic root and annular dilatation. Aortic annular dilatation predisposes to aortic valve insufficiency (regurgitation) and aortic aneurysm formation.
Coarctation of the aorta is more commonly associated with Turner syndrome. Parachute mitral valve and cleft mitral valve are congenital abnormalities linked to other syndromes or defects but not typical in Marfan syndrome.
This association is described in the "Textbook of Clinical Echocardiography, 6e", Chapter on Genetic Syndromes and Cardiovascular Manifestations【20:120-125†Textbook of Clinical Echocardiography】.QUESTION NO: 91
Which condition causes both tricuspid stenosis and tricuspid regurgitation?
A. Pulmonary hypertension
B. Cor pulmonale
C. Carcinoid heart disease
D. Amyloid heart disease
Answer: C
Comprehensive and Detailed Explanation From Exact Extract:
Carcinoid heart disease results from the deposition of fibrous plaques on the endocardium of right-sided heart valves, predominantly affecting the tricuspid and pulmonary valves. This leads to both tricuspid stenosis (valve leaflet thickening and immobility causing obstruction) and tricuspid regurgitation (incomplete coaptation due to leaflet retraction).
Pulmonary hypertension and cor pulmonale cause primarily functional tricuspid regurgitation without stenosis. Amyloid heart disease can cause restrictive cardiomyopathy but rarely causes combined tricuspid valve stenosis and regurgitation.
These pathological changes are detailed in the "Textbook of Clinical Echocardiography, 6e", Chapter on Carcinoid Heart Disease and Right Heart Valve Disease【20:335-340†Textbook of Clinical Echocardiography】.
Which flow component is indicated by the arrows on this image?

Ventricular reversal
Diastolic flow reversal
Atrial reversal
Systolic forward flow
The Doppler waveform shows pulmonary vein flow with several components. The arrows point to small reversed flow spikes just after the atrial contraction wave, which corresponds to the atrial reversal (AR) flow component. Atrial reversal occurs as blood briefly flows backward into the pulmonary veins during atrial contraction.
Ventricular reversal is not typically seen in pulmonary veins. Diastolic flow reversal is abnormal and usually not part of normal pulmonary vein flow. Systolic forward flow is the major forward component during ventricular systole.
This interpretation is standard in ASE guidelines on diastolic function assessment and pulmonary vein Doppler evaluation【12:ASE Diastolic Function Guidelines†p.85-90】【16:Textbook of Clinical Echocardiography, 6e†p.130-135】.
TESTED 10 Jul 2026
Copyright © 2014-2026 DumpsTool. All Rights Reserved