An online sales company has a table data source that contains Order Date. Products ship on the first day of each month for all orders from the previous month.
The consultant needs to know the average number of days that a customer must wait before a product is shipped.
Which calculation should the consultant use?
A client has many published data sources in Tableau Server. The data sources use the same databases and tables. The client notices different departments
give different answers to the same business questions, and the departments cannot trust the data. The client wants to know what causes data sources to return
different data.
Which tool should the client use to identify this issue?
From the desktop, open the CC workbook.
Open the Manufacturers worksheet.
The Manufacturers worksheet is used to
analyze the quantity of items contributed by
each manufacturer.
You need to modify the Percent
Contribution calculated field to use a Level
of Detail (LOD) expression that calculates
the percentage contribution of each
manufacturer to the total quantity.
Enter the percentage for Newell to the
nearest hundredth of a percent into the
Newell % Contribution parameter.
From the File menu in Tableau Desktop, click
Save.
From the desktop, open the CC workbook.
Open the Incremental worksheet.
You need to add a line to the chart that
shows the cumulative percentage of sales
contributed by each product to the
incremental sales.
From the File menu in Tableau Desktop, click
Save.
From the desktop, open the CC workbook.
Open the City Pareto worksheet.
You need to complete the Pareto chart to show the percentage of sales compared to the percentage of cities. The chart must show references lines to visualize how the data compares to the Pareto principle.
From the File menu in Tableau Desktop, click Save.
Use the following login credentials to sign in
to the virtual machine:
Username: Admin
Password:
The following information is for technical
support purposes only:
Lab Instance: 40201223
To access Tableau Help, you can open the
Help.pdf file on the desktop.
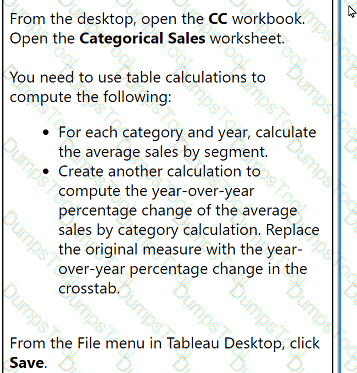
From the desktop, open the CC workbook.
Open the Categorical Sales worksheet.
You need to use table calculations to
compute the following:
. For each category and year, calculate
the average sales by segment.
. Create another calculation to
compute the year-over-year
percentage change of the average
sales by category calculation. Replace
the original measure with the year-
over-year percentage change in the
crosstab.
From the File menu in Tableau Desktop, click
Save.
From the desktop, open the CC workbook. Use the US Population Estimates data source.
You need to shape the data in US Population Estimates by using Tableau Desktop. The data must be formatted as shown in the following table.
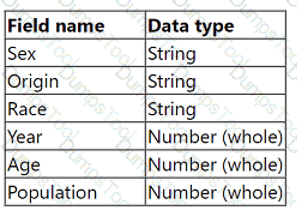
Open the Population worksheet. Enter the total number of records contained in the data set into the Total Records parameter.
From the File menu in Tableau Desktop, click Save.
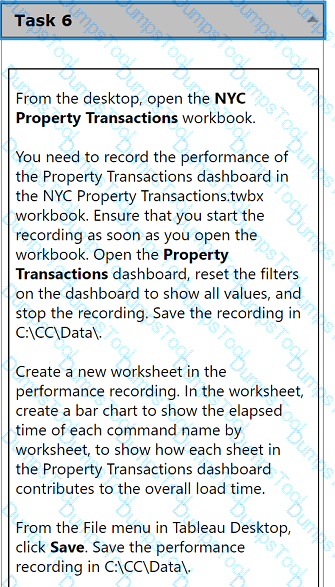
From the desktop, open the NYC
Property Transactions workbook.
You need to record the performance of
the Property Transactions dashboard in
the NYC Property Transactions.twbx
workbook. Ensure that you start the
recording as soon as you open the
workbook. Open the Property
Transactions dashboard, reset the filters
on the dashboard to show all values, and
stop the recording. Save the recording in
C:\CC\Data\.
Create a new worksheet in the
performance recording. In the worksheet,
create a bar chart to show the elapsed
time of each command name by
worksheet, to show how each sheet in
the Property Transactions dashboard
contributes to the overall load time.
From the File menu in Tableau Desktop,
click Save. Save the performance
recording in C:\CC\Data\.
A client needs to design row-level security (RLS) measures for their reports. The client does not currently have Tableau Data Management Add-on, and it
may be an option in the future.
What should the consultant recommend as the safest and easiest way to manage for the long term?
A client has a Tableau Cloud deployment. Currently, dashboards are available only to internal users.
The client needs to embed interactive Tableau visualizations on their public website.
Data is <</b> 5,000 rows, updated infrequently via manual refresh.
Cost is a priority.
Which product should the client use?
A consultant migrated a data source to improve performance. The consultant wants to identify which workbooks need to be updated to point to the new data
source.
Which Tableau tool should the consultant use?
A client has a dashboard that renders in less than 10 seconds. The client receives a request to add a new calculated field that will return TRUE if a Project contains any one of the values "Project 1" or "Project 2" and FALSE otherwise. After adding the function found below, the dashboard's render time increases to 14 seconds from 10 seconds.
[Project] = 'Project 1' OR [Project] = 'Project 2'
Which function should the consultant use to reduce the render time?
A university has data on its undergraduate students and their majors by grade level (Freshman, Sophomore, Junior, Senior). The university is interested in
visualizing the path students take as they change majors across grade levels.
Which visualization type should the consultant recommend?
A company uses an extract built from Custom SQL joining Claims and Members.
Members have multiple records in both tables → causing data duplication, which results in inflated claim cost trends.
Which approach meets performance and maintenance goals?
A transport and delivery company uses a command center dashboard in its logistics and distribution hubs. The dashboard is displayed on screens to show fleet movements, delivery status, and warehouse operations. The company needs the dashboard to provide up-to-date information without human intervention. The company's environment cannot access the internet, and the data source is configured to maintain a real-time connection.
How should the company meet this requirement?

TESTED 25 Jun 2026