As a means of measuring the effects on other areas of a process as a result of changes in the primary metric we also define and track ________________.
Data that can be measured on a continuum and has meaningful decimal subdivisions are __________ data.
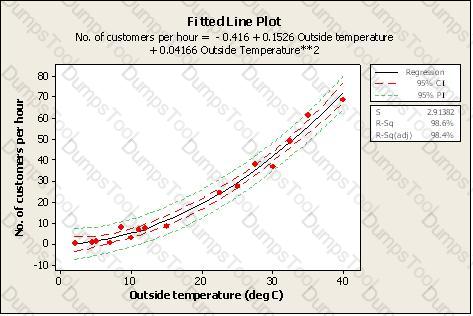
Which statement(s) are correct about the Regression shown here? (Note: There are 2 correct answers).
Which Experimental Design typically is most associated with the fewest number of input variables or factors in the design?
A valid Multiple Linear Regression (MLR) is characterized by all of these except?
Accuracy can be assessed in several ways and a fairly accurate means of measurement is visual comparison.
Fractional Factorial designs are used to reduce the ____________ because the number of runs has been lowered.
A valuable tool to use during the Measure Phase to show material and information flow throughout an entire process is the ______________ .
A dock worker for a feed supplier was tasked with assuring the proper weight in the feed bags as they left the dock. One of the columns listed the range of weight of the bags included in the studies. This required plotting a Histogram of the weight of the bags. While drawing the Histogram the x-axis contained a certain scale of data. Pick the scale of data that is appropriate for Histograms.
A Belt has determined that the inventory of repair parts at a rework station can be reduced by 45%. According to Cost of Poor Quality (COPQ) definitions inventory reduction would be considered _______________.
The Normal Distribution is considered to be the most important distribution in statistics and, among other things is defined as having a total area under the curve of 1, is mounded and symmetrical and the Mean, Median and Mode are _____________.
If the production is for higher volume and monitoring and the Mean and variability is to be monitored for four machines producing product and the characteristic to be monitored is Variable Data, which SPC Chart is best to be selected?
A valid Multiple Linear Regression (MLR) is characterized by all of these except _______________________.
The two types of data that can be used in Statistical Analysis are Attribute and Variable.
An operator checks that all boxes being packed contain enough products to fill the box. However, each box getting filled has a different number of products in it. This is a Reproducibility problem, not a Repeatability problem.
A Belt working in a supply chain environment has to make a decision to change suppliers of critical raw materials for a new product upgrade. The purchasing manager is depending on the Belt’s effort requiring that the average cost of an internal critical raw material component be less than or equal to $4,200 in order to stay within budget. Using a sample of 35 first article components, a Mean of the new product upgrade price of $4,060, and a Standard Deviation of $98 was estimated. The Alternative Hypothesis in the above example is?
When we gather information for the Voice of the Business we are primarily interested in information concerning the _____________ of the business.
At the very initiation of a project a Belt must develop a concise _______________ that states at a high level the area of concern and why it is important this issue be improved.
A Full Factorial experiment using a 3 level 3 factor approach has been proposed to test the viability of an extrusion machine experiment. How many treatment combinations will this approach involve?
Handling of warranty returns, process improvement team meetings and rework to meet customer expectations are all examples of business costs that are classified as ________________ .
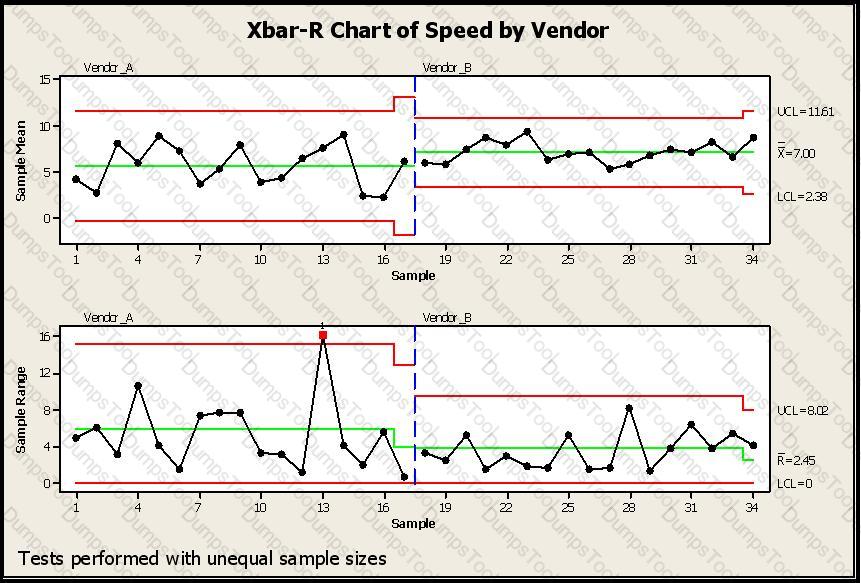
SPC Charts are used extensively in different business and decision-making environments. In this example a vendor is being selected based on speed of delivery. Which of the conclusions would help you pick a vendor for your needs regarding lead-time of delivery from your vendors? (Note: There are 4 correct answers).
Production Line 1 is able to complete 500 units per shift. Production Line 2 is able to finish 1,500 units per shift. Production Line 2 is 3 times faster than Production Line 1. This analysis is an example of ______________ Scale Data.
Which of these graphical presentations displays the values of each individual reading?
The Greek letter “sigma” is used by mathematicians to signify _____________.
A Belt working in a supply chain environment has to make a decision to change suppliers of critical raw materials for a new product upgrade. The purchasing manager is depending on the Belt’s effort requiring that the average cost of an internal critical raw material component be less than or equal to $2,800 in order to stay within budget. Using a sample of 55 first article components, a Mean of the new product upgrade price of $2,240 and a Standard Deviation of $120 was estimated. Based on the data provided, the Z value for the data assuming a Normal Distribution is?
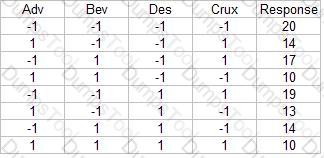
What conclusion is most correct about the Experimental Design shown here with the response in the far right column?
Using this partial Z Table, how many units from a month’s production run are expected to not satisfy customer requirements for the following process?
Upper specification limit: 8.4 Lower specification limit: 4.7 Mean of the process: 6.2 Standard Deviation: 2.2 Monthly production: 360 units
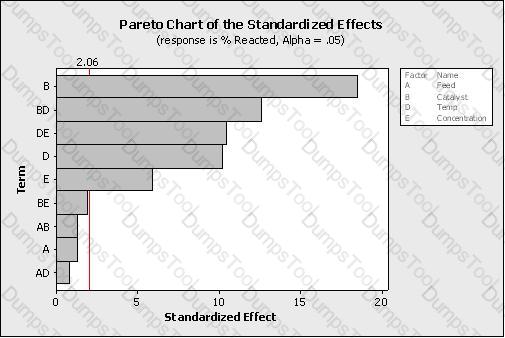
Which statement(s) are correct about the Pareto Chart shown here for the DOE analysis? (Note: There are 2 correct answers).
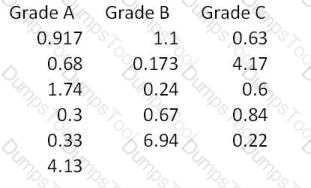
For the data shown here which statement(s) are true? (Note: There are 2 correct answers).
What conclusion is most correct about the Experimental Design shown here with the response in the far right column?

Some of the sources for different types of error that can be quantified using Statistical Analysis are which of these?
For a Normal Distribution as samples size increases the Range in Mean and Standard Deviation decrease relative to the Mean and Standard Deviation of the population.
If a Six Sigma project was to reduce changeover times and the team found the project success was decreasing over time since changeover times began to creep back up, which Lean tools should be considered in the Control Phase to reestablish and sustain the project success?
A(n) ______________ is best used to compare a Machine 1 average quality characteristic to the same quality characteristic of Machine 2.
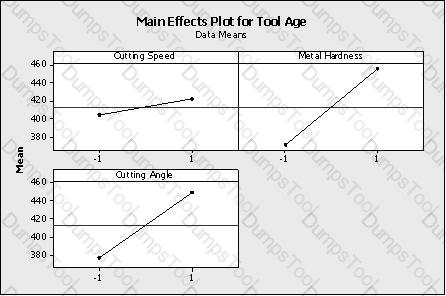
Which statement(s) are correct about the DOE Factorial plot output here? (Note: There are 3 correct answers).
A ___________ is used primarily to track the stability of the average value of a metric of interest.

TESTED 24 Jun 2026