From Power BI Desktop, you publish a new dataset and report lo a Power Bl workspace. The dataset has a row-level security (RLS) role named HR. You need to ensure that the HR team members have RLS applied when they view reports based on the dataset. What should you do?
Note: This question is part of a series of questions that present the same scenario. Each question in the series contains a unique solution that might meet the stated goals. Some question sets might have more than one correct solution, while others might not have a correct solution.
After you answer a question in this section, you will NOT be able to return to it. As a result, these questions will not appear in the review screen.
You are modeling data by using Microsoft Power Bl. Part of the data model is a large Microsoft SQL Server table named Order that has more than 100 million records.
During the development process, you need to import a sample of the data from the Order table.
Solution: You add a report-level filter that filters based on the order date.
Does this meet the goal?
Note: This question is part of a series of questions that present the same scenario. Each question in the series contains a unique solution that might meet the stated goals. Some question sets might have more than one correct solution, while others might not have a correct solution.
After you answer a question in this scenario, you will NOT be able to return to it. As a result, these questions will not appear in the review screen.
You have a clustered bar chart that contains a measure named Salary as the value and a field named Employee as the axis. Salary is present in the data as numerical amount representing US dollars.
You need to create a reference line to show which employees are above the median salary.
Solution: You create a percentile line by using the Salary measure and set the percentile to 50%.
Does this meet the goal?
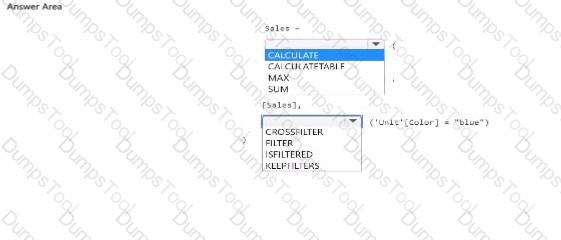
You have a Power BI semantic model named Model1.
You need to create a measure that will display the sales result for all units. The solution must maintain the existing filter.
How should you complete the DAX expression? TO answer, select the appropriate options in the answer area.
NOTE: Each correct selection is worth one point.
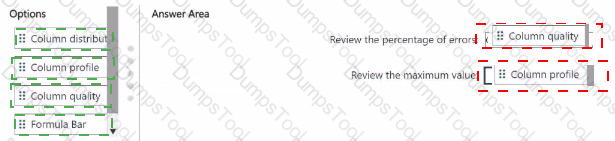
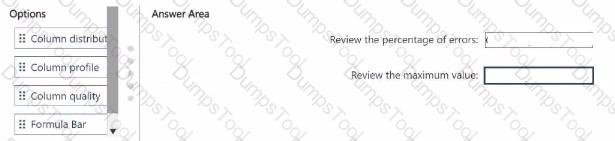
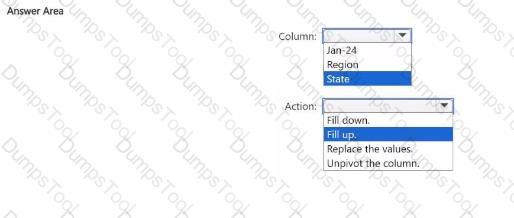
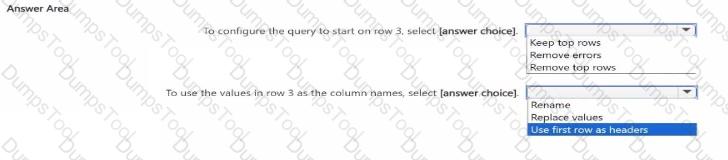
You a-e using Power Bl Desktop 10 profile data in Power Query Editor.
You need to review the percentage of errors and the maximum value of each column.
Which options should you use in Power Query Editor? To answer, drag the appropriate options to the correct requirements. Each option may be used once, more than once, or not at all. You may need to drag the split bar between panes or scroll to view content.
NOTE: Each correct selection is worth one point.
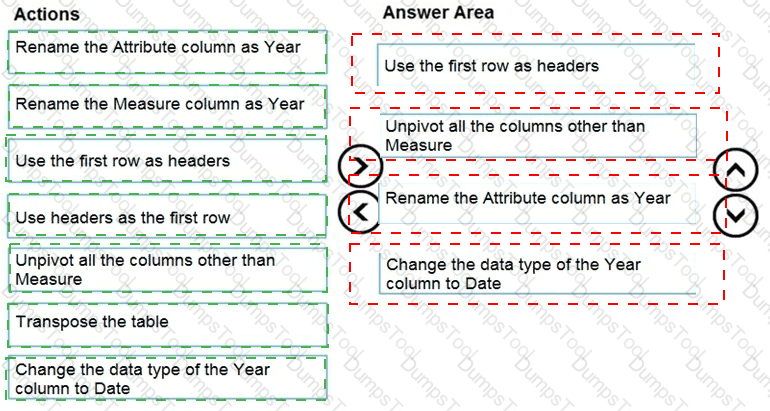
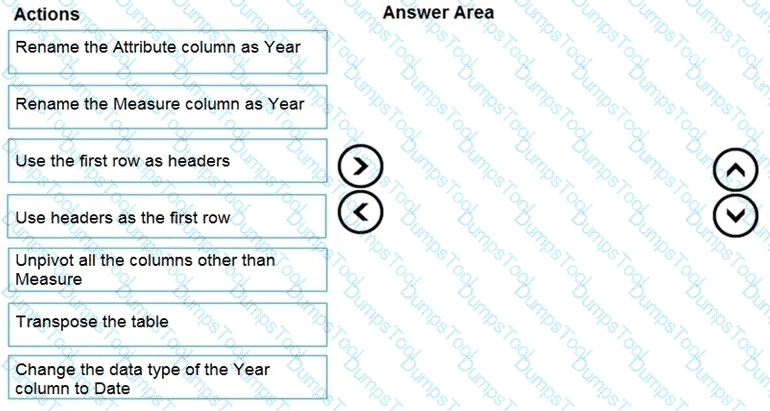
You are preparing a financial report in Power BI.
You connect to the data stored in a Microsoft Excel spreadsheet by using Power Query Editor as shown in the following exhibit.
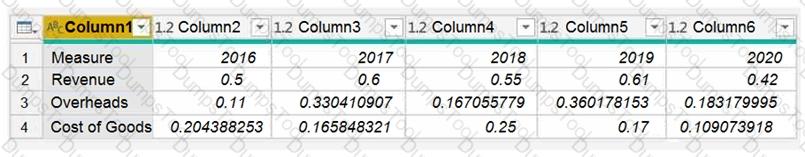
You need to prepare the data to support the following:
Visualizations that include all measures in the data over time
Year-over-year calculations for all the measures
Which four actions should you perform in sequence? To answer, move the appropriate actions from the list of actions to the answer area and arrange them in the correct order.
You have a semantic model that connects to a streaming data source. The data source is updated frequently. You need to create a Power B1 report that meets the following requirements:
• Supports real-time analytics
• Minimizes performance impact on the data source
• Displays the most recent data without performing a data refresh
Which connectivity mode should you use for the dataset?
You attempt to connect Power BI Desktop to a Cassandra database.
From the Get Data connector list, you discover that there is no specific connector for the Cassandra database.
You need to select an alternate data connector that will connect to the database.
Which type of connector should you choose?
You have a Power 31 data model that contains a table named Stores. The table has the following columns:
* Store Name
* Open Date
* Status
* State
* City
You need to create a calculated column named Active Store Name that meets the following requirements:
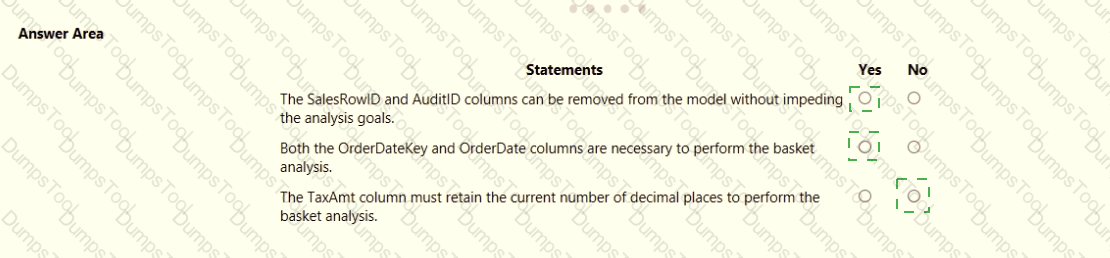
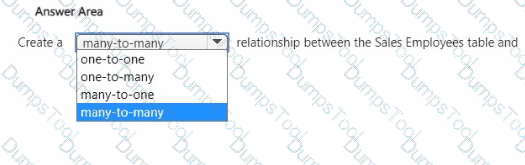
You are creating a Microsoft Power Bl imported data model to perform basket analysis. The goal of the analysis is to identify which products are usually bought together in the same transaction across and within sales territories.
You import a fact table named Sales as shown in the exhibit. (Click the Exhibit tab.)
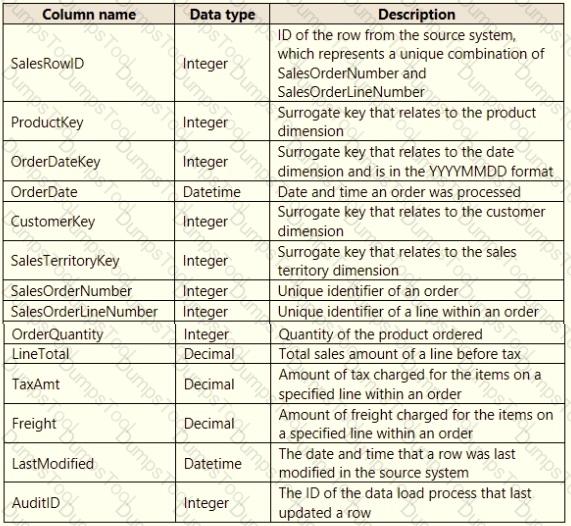
The related dimension tables are imported into the model.
For each of the following statements, select Yes if the statement is true. Otherwise, select No.
NOTE: Each correct selection is worth one point.
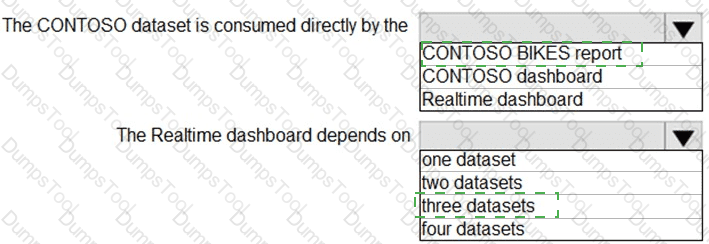
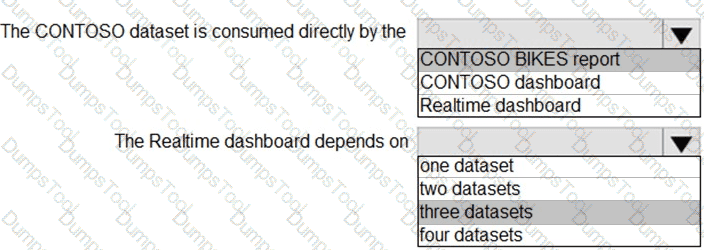
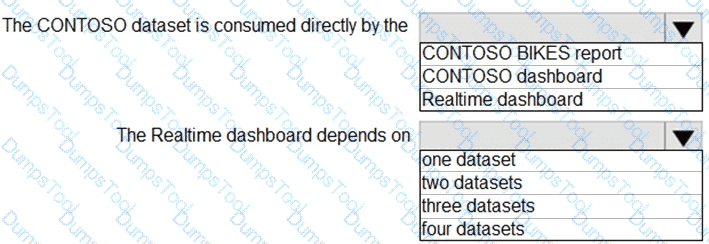
You have the data lineage shown in the following exhibit.
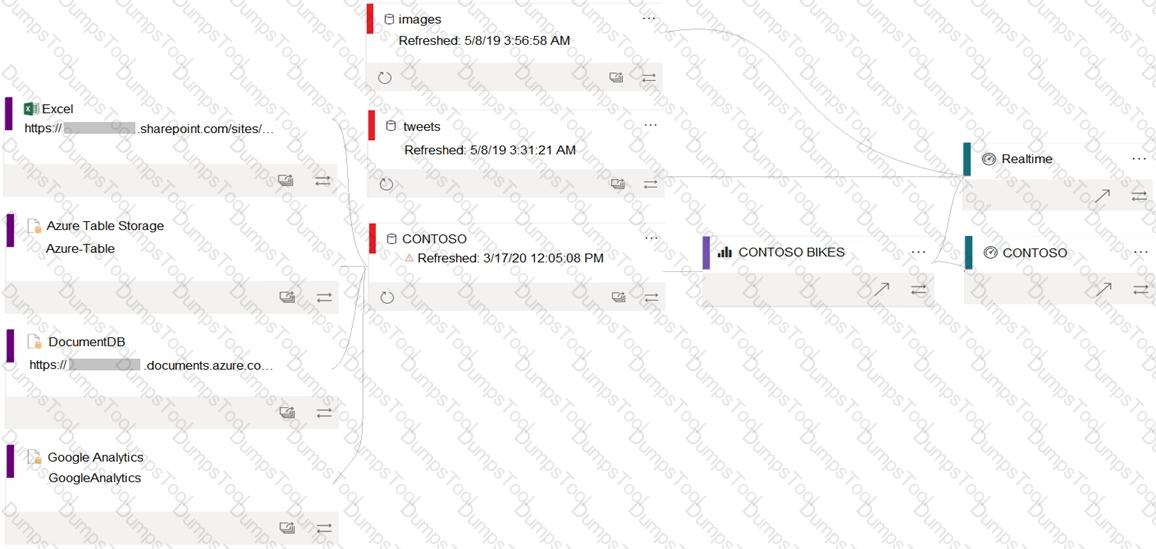
Use the drop-down menus to select the answer choice that completes each statement based on the information presented in the graphic.
NOTE: Each correct selection is worth one point.
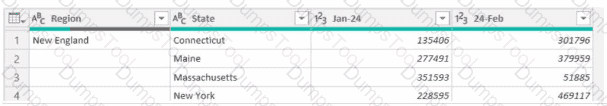
You have a CSV file that contains user complaints. The file contains a column named Logged logged contains the date and time each complaint occurred. The data in Logged is m the following format: 2018-12-31 at 08:59.
You need to be able to analyze the complaints by the logged date and use a built-in date hierarchy.
What should you do?
You need to create a visual that compares profit across 10 product categories for a selected quarter.
What is the best visual to use to achieve the goal? More than one answer choice may achieve the goal Select the BEST answer.
You create a dashboard by using the Microsoft Power Bl Service. The dashboard contains a card visual that shows total sales from the current year. You grant users access to the dashboard by using the viewer role on the workspace. A user wants to receive daily notifications of the number shown on the card visual. You need to automate the notifications. What should you do?
Your company has employees in 10 states.
The company recently decided to associate each state to one of the following three regions: East, West, and North.
You have a data model that contains employee information by state. The model does NOT include region
information.
You have a report that shows the employees by state.
You need to view the employees by region as quickly as possible.
What should you do?
You have a dashboard that contains tiles pinned from a single report as shown in the Original Dashboard exhibit. (Click the Original Dashboard tab.)
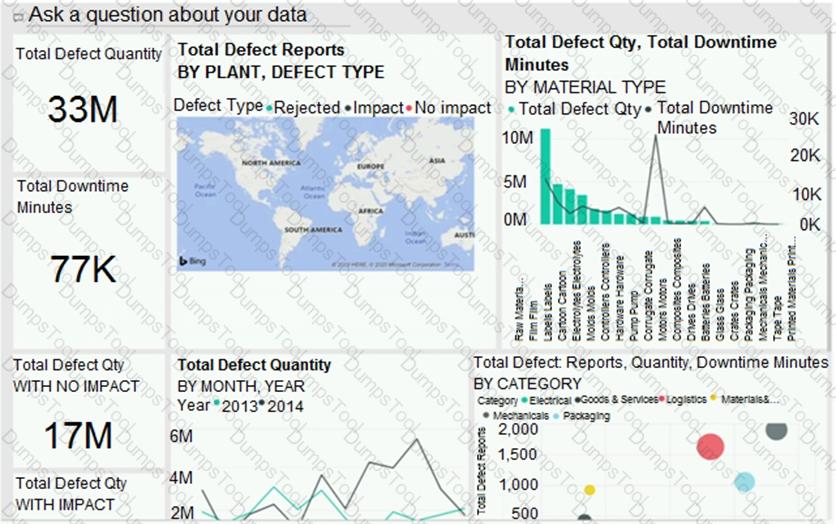
You need to modify the dashboard to appear as shown in the Modified Dashboard exhibit. (Click the Modified Dashboard tab.)
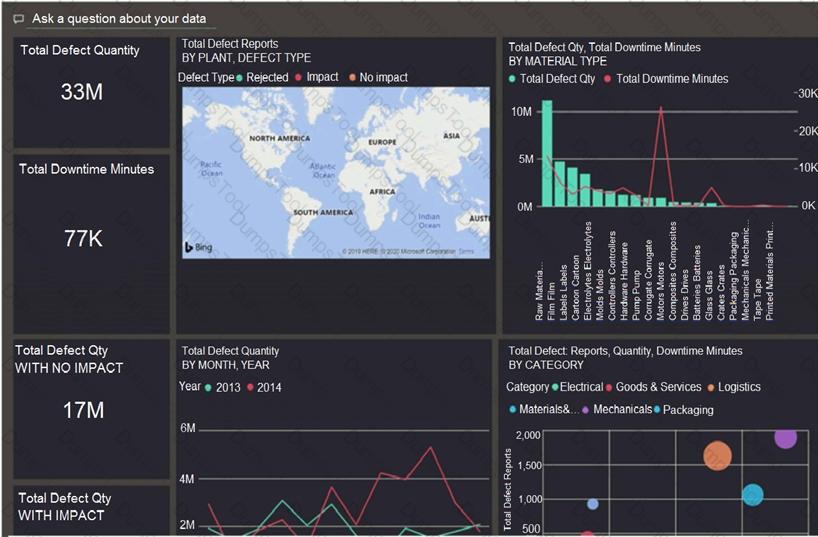
What should you do?
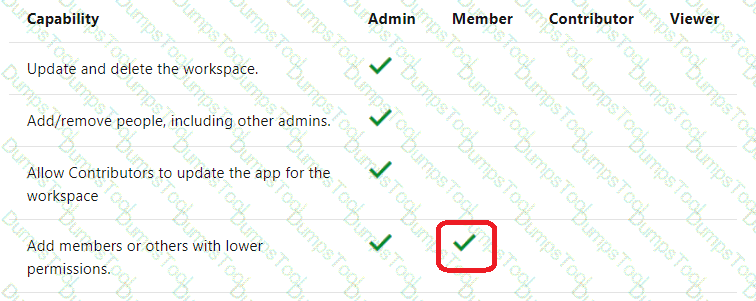
You have a collection of reports for the HR department of your company. The datasets use row-level security (RLS). The company has multiple sales regions that each has an HR manager. You need to ensure that the HR managers can interact with the data from their region only. The HR managers must be prevented from changing the layout of the reports. How should you provision access to the reports for the HR managers?
You have a Power BI tenant.
You have reports that use financial datasets and are exported as PDF files.
You need to ensure that the reports are encrypted.
What should you implement?
You have a Fabric workspace named Workspace1 and a group named Group1.
You need to ensure that the members of Group1 are notified when there are issues in Workspace1. The solution must follow the principle of least privilege.
What should you do?
Note: This question is part of a series of questions that present the same scenario. Each question in the series contains a unique solution that might meet the stated goals. Some question sets might have more than one correct solution, while others might not have a correct solution.
After you answer a question in this scenario, you will NOT be able to return to it. As a result, these questions will not appear in the review screen.
You have a clustered bar chart that contains a measure named Salary as the value and a field named Employee as the axis. Salary is present in the data as numerical amount representing US dollars.
You need to create a reference line to show which employees are above the median salary.
Solution: You create a median line by using the Salary measure.
Does this meet the goal?
You have a Power Bl model that contains the following data.
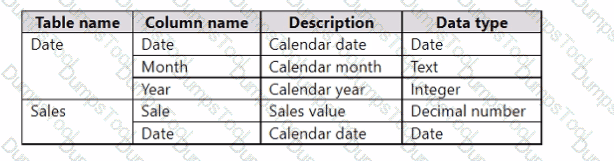
The Date table relates to the Sales table by using the Date columns.
The model contains the following DAX measure.
Total Sales = SUM(Sales[Sale])
You need to create another measure named Previous Quarter to display the sales one quarter before the selected period.
Which DAX calculation should you use?
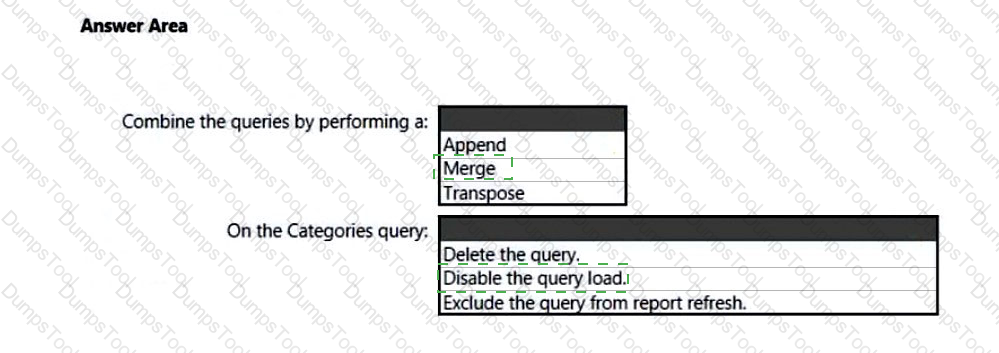
You have two CSV files named Products and Categories.
The Products file contains the following columns:
ProductID
ProductName
SupplierID
CategoryID
The Categories file contains the following columns:
CategoryID
CategoryName
CategoryDescription
From Power BI Desktop, you import the files into Power Query Editor.
You need to create a Power BI dataset that will contain a single table named Product. The Product will table includes the following columns:
ProductID
ProductName
SupplierID
CategoryID
CategoryName
CategoryDescription
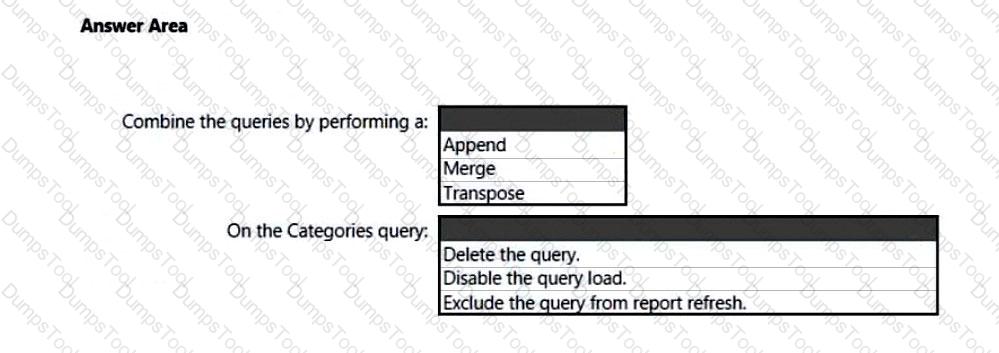
How should you combine the queries, and what should you do on the Categories query? To answer, select the appropriate options in the answer area.
NOTE: Each correct selection is worth one point.
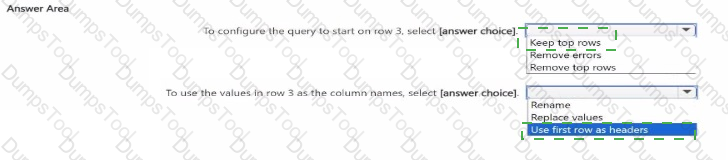
You use Power Query Editor to review the query shown in the following exhibit.
You use Power BI Desktop to open a PBIX file that contains a Microsoft Excel data source.
You attempt to refresh the data and receive the following error message.
Expression.Error: The Colum ‘cost’ of the table wasn’t found.
What is a possible cause of the error?
You have a Power Bi report. The report contains a visual that snows gross sales by date The visual has anomaly detection enabled.
No anomalies ate detected
You need to increase the likelihood that anomaly detection will identify anomalies in the report.
What should you do?
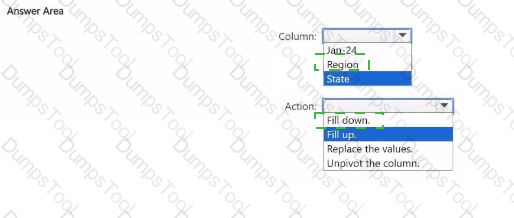
You use Power Query Editor to preview the data shown in the following exhibit.
You have a Power Bl report that uses row-level security (RLS).
You need to transfer RLS membership maintenance to an Azure network security team. The solution must NOT provide the Azure network security team with the ability to manage reports, datasets. or dashboards.
What should you do?
You are creating a dashboard by using the Power Bl service.
You have an existing report page that contains three charts.
You need to add the charts to the dashboard while maintaining the interactivity between the charts.
What should you do?
You have a semantic model that contains a table named Employees. The table contains the following columns:
• Employee ID
• First Name
• Last Name
• Department
• Salary
Each employee is uniquely identified by using Employee ID.
You need to create a DAX measure that will calculate the average salary of all the employees in the sales department.
Which DAX expression should you use?
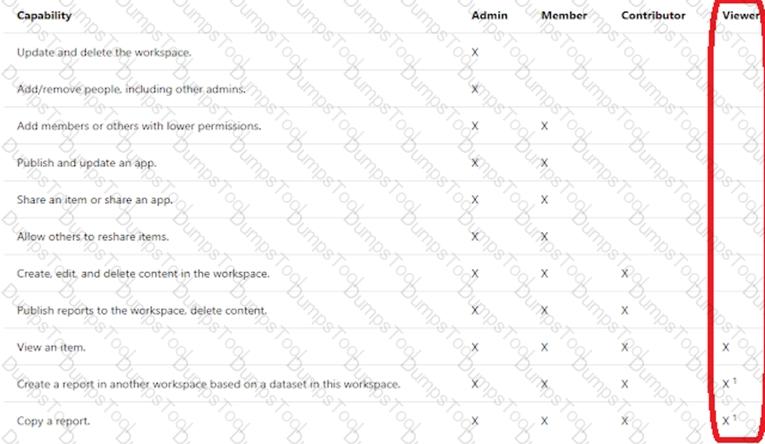
You need to provide a user with the ability to add members to a workspace. The solution must use the principle of least privilege.
Which role should you assign to the user?
You need to design the data model to meet the report requirements.
What should you do in Power BI Desktop?
You need to create the semantic model.
Which storage mode should you use for the tables in the semantic model?
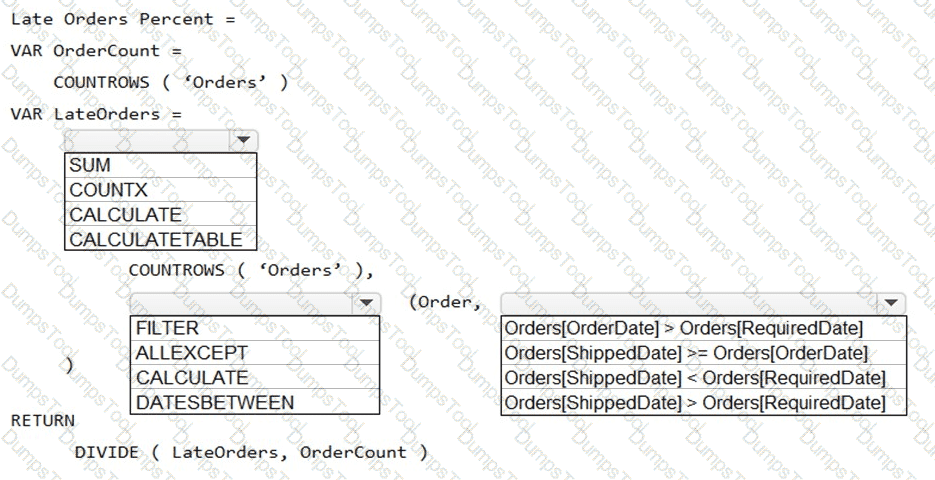
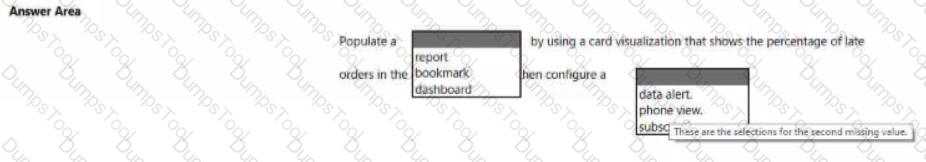
You need to create the On-Time Shipping report. The report must include a visualization that shows the percentage of late orders.
Which type of visualization should you create?
You need to configure access for the sales department users. The solution must me meet the security requirements. What should you do?
You need to create a relationship in the data model for RLS.
What should you do? To answer, select the appropriate options in the answer area.
NOTE: Each correct selection is worth one point.
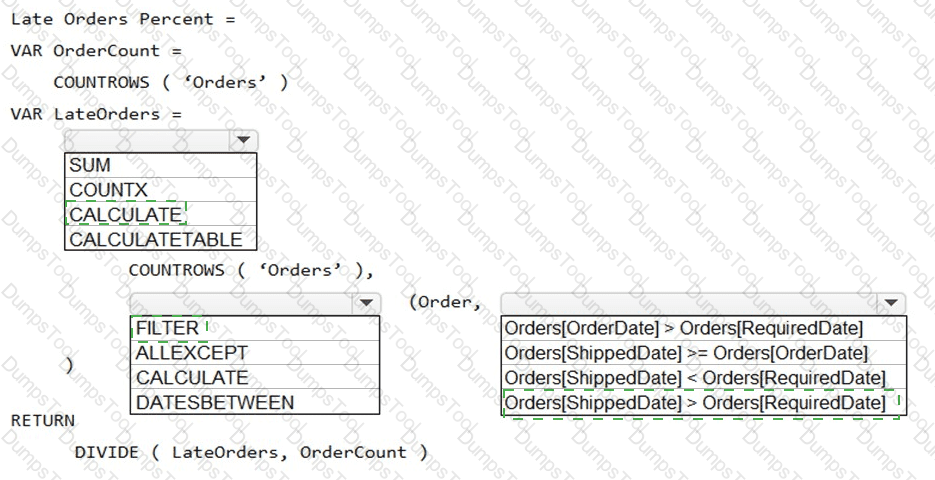
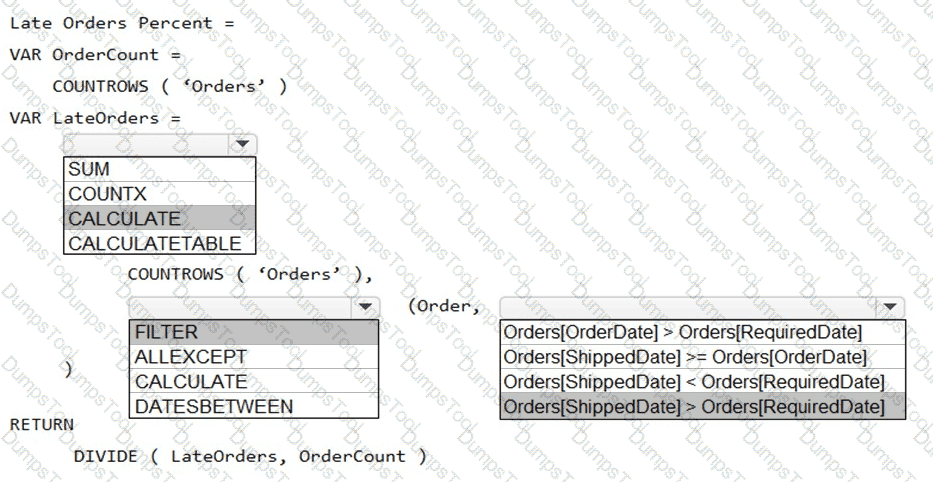
You need to create a measure that will return the percentage of late orders.
How should you complete the DAX expression? To answer, select the appropriate options in the answer area.
NOTE: Each correct selection is worth one point.
You need to minimize me size of the dataset. The solution must meet the report requirements What should you do?
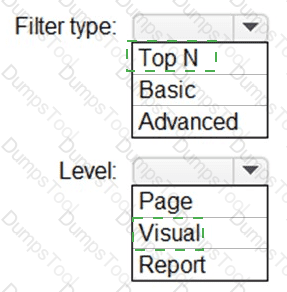
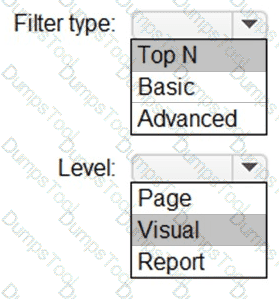
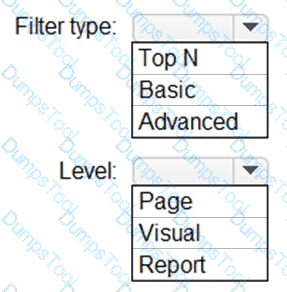
You need to create the Top Customers report.
Which type of filter should you use, and at which level should you apply the filter? To answer, select the appropriate options in the answer area.
NOTE: Each correct selection is worth one point.
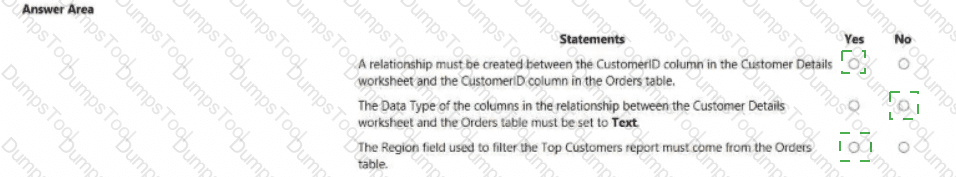
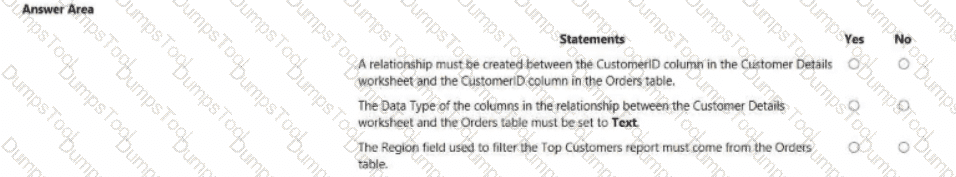
You need to design the data model and the relationships for the Customer Details worksheet and the Orders table by using Power BI. The solution must meet the report requirements.
For each of the following statement, select Yes if the statement is true, Otherwise, select No.
NOTE: Each correct selection is worth one point.
You need to minimize the size of the semantic model. The solution must meet the report requirements.
What should you do?
You need to create a solution to meet the notification requirements of the warehouse shipping department.
What should you do? To answer, select the appropriate options in the answer area.
NOTE: Each correct select is worth one point:
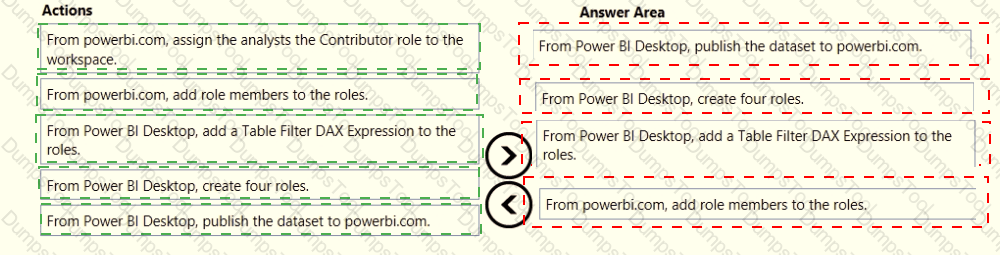
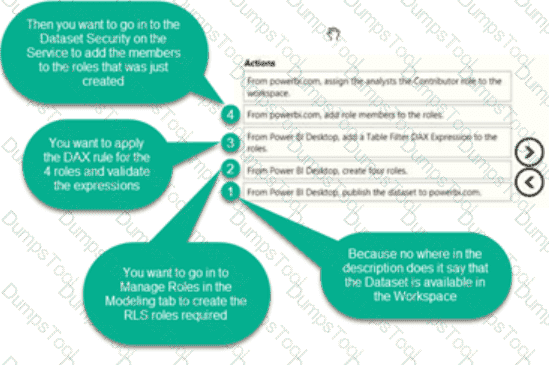
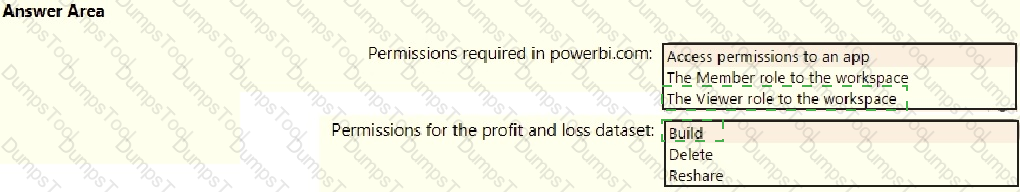
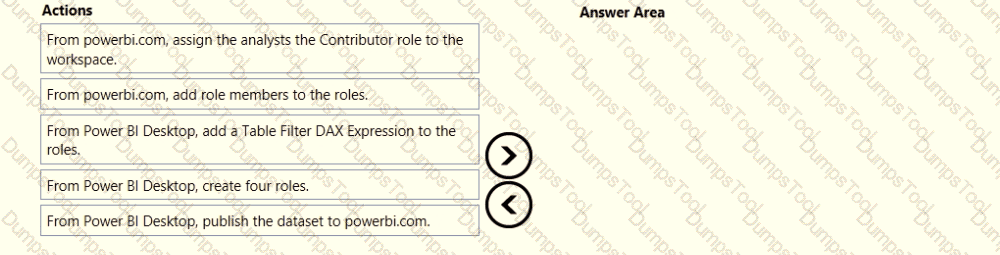
Once the profit and loss dataset is created, which four actions should you perform in sequence to ensure that the business unit analysts see the appropriate profit and loss data? To answer, move the appropriate actions from the list of actions to the answer area and arrange them in the correct order.
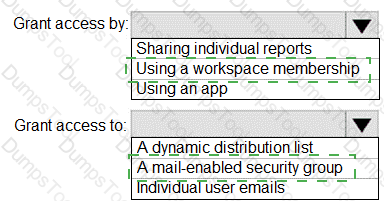
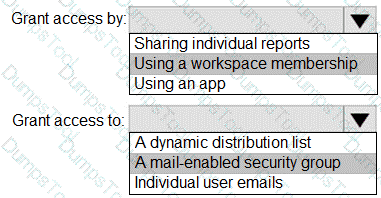
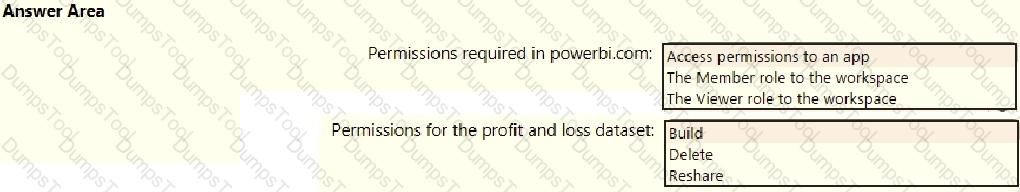
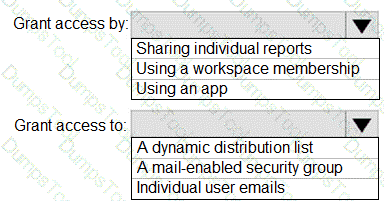
You need to grant access to the business unit analysts.
What should you configure? To answer, select the appropriate options in the answer area.
NOTE: Each correct selection is worth one point.
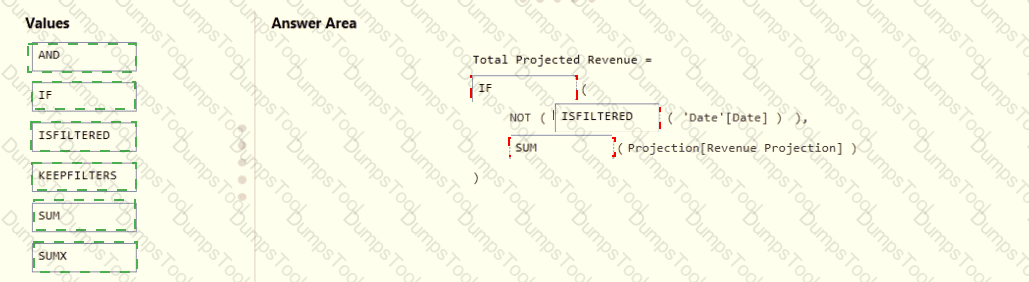
You need to create a DAX measure in the data model that only allows users to see projections at the appropriate levels of granularity.
How should you complete the measure? To answer, drag the appropriate values to the correct targets. Each value may be used once, more than once, or not at all. You may need to drag the split bar between panes or scroll to view content.
NOTE: Each correct selection is worth one point.

You need to recommend a strategy to consistently define the business unit, department, and product category data and make the data usable across reports.
What should you recommend?
You need to create the relationship between the product list and the revenue results. The solution must minimize the time it takes to render visuals.
What should you set as the relationship cardinality?
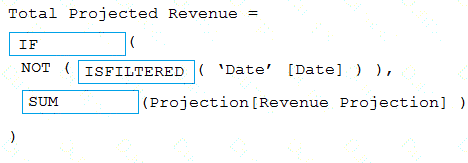
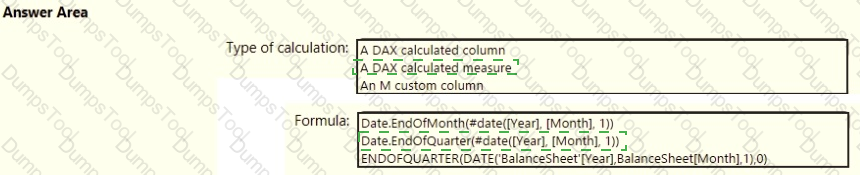
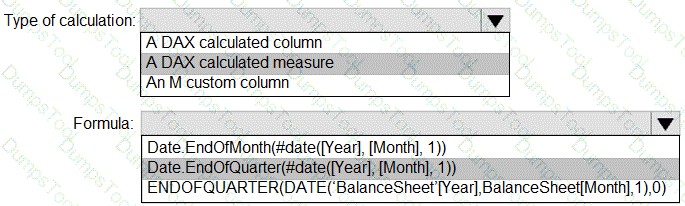
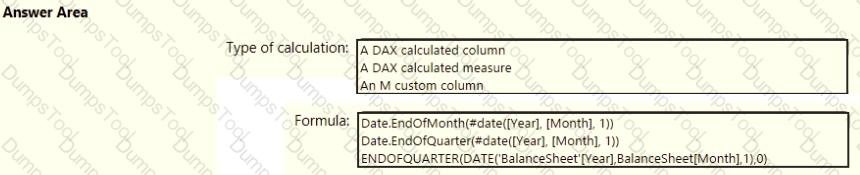
You need to calculate the last day of the month in the balance sheet data to ensure that you can relate the balance sheet data to the Date table. Which type of calculation and which formula should you use? To answer, select the appropriate options in the answer area. NOTE: Each correct selection is worth one point.
You need to ensure that the data is updated to meet the report requirements. The solution must minimize configuration effort.
What should you do?
How should you distribute the reports to the board? To answer, select the appropriate options in the answer area.
NOTE: Each correct selection is worth one point.
Which two types of visualizations can be used in the balance sheet reports to meet the reporting goals? Each correct answer presents part of the solution.
NOTE: Each correct selection is worth one point.
What is the minimum number of datasets and storage modes required to support the reports?
You need to address the data concerns before creating the data model. What should you do in Power Query Editor?
You need to get data from the Microsoft SQL Server tables. What should you use to configure the connection'
You publish the dataset to powerbi.com.
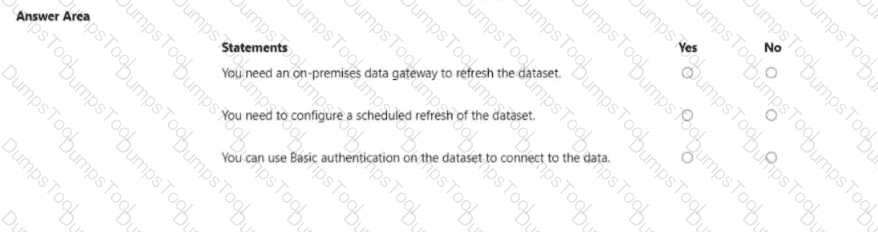
For each of the following statements, select Yes if the statement is true. Otherwise, select No.
NOTE: Each correct selection is worth one point.
Which DAX expression should you use to get the ending balances in the balance sheet reports?
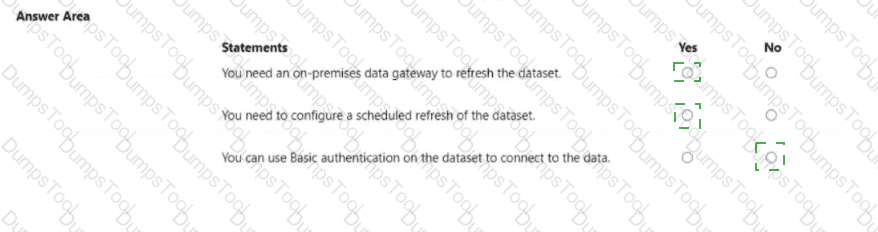
You publish the semantic model to powerbi.com.
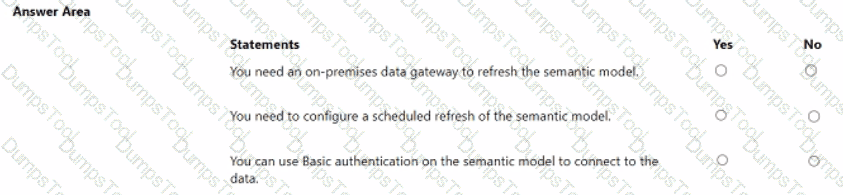
For each of the following statements, select Yes if the statement is true. Otherwise, select No.
NOTE: Each correct selection is worth one point.
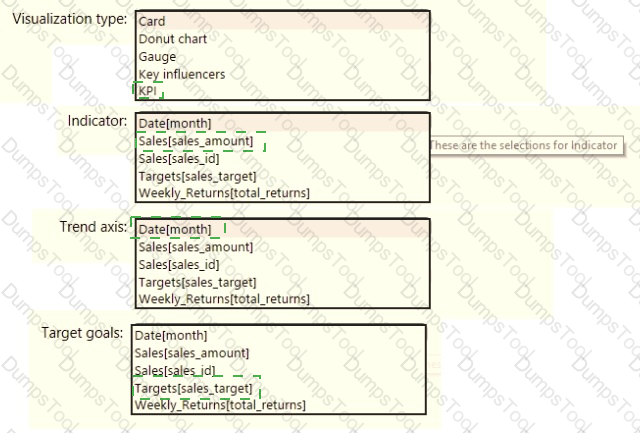
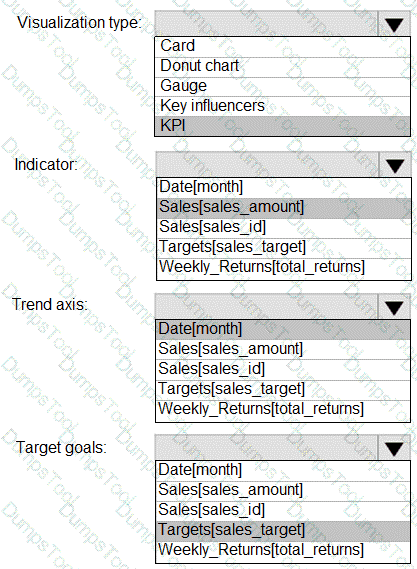
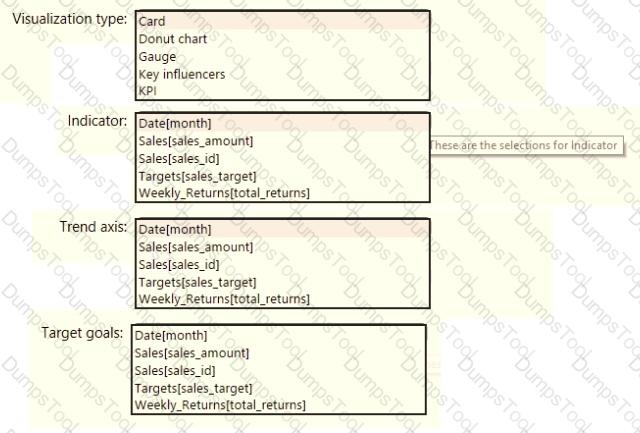
You need to create a visualization to meet the reporting requirements of the sales managers.
How should you create the visualization? To answer, select the appropriate options in the answer area.
NOTE: Each correct selection is worth one point.
You need to create a relationship between the Weekly_Returns table and the Date table to meet the reporting requirements of the regional managers. What should you do?
You need to create relationships to meet the reporting requirements of the customer service department.
What should you create?
You need to provide a solution to provide the sales managers with the required access.
What should you include in the solution?
You merge data from Sales.Region, Region_Manager, Sales_Manager, and Manager into a single table named Region. What should you do next to meet the reporting requirements of the executives?
What should you create to meet the reporting requirements of the sales department?
You need to create the required relationship for the executive's visual. What should you do before you can create the relationship?
You need to create a calculated column to display the month based on the reporting requirements. Which DAX expression should you use?

TESTED 10 Jun 2026