dumpstool logo

A researcher collected data on the traffic frequency on a section of road. The results are shown in the scatterplot. A regression function is graphed with r^2=0.96. The predicted traffic frequency 16.2 hours after dawn is 70 cars per minute.
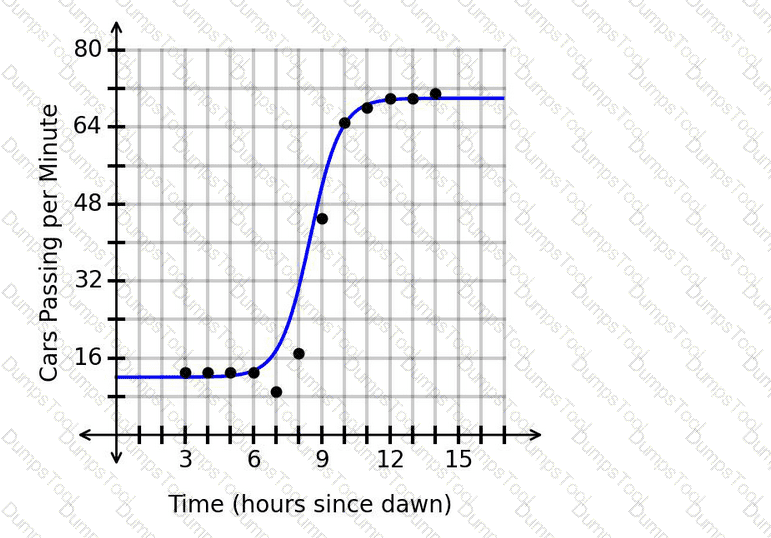
Is this prediction appropriate?
The given function represents the price of a commodity, p, in dollars, based on the number of months, m, since the beginning of 2020.
p(m)=5m+5
What is the average rate of change of the price over the interval m=1to m=10?
A vehicle is traveling away from a town at a fixed rate. After 1 hours, the vehicle is 200 miles from the town. After 4 hours, the vehicle is 395 miles from the town.
Which function represents the distance, d, between the vehicle and the town after thours?
The graph shows the daily practice duration for a musician, where the number of days since the beginning of the month is along the horizontal axis and the number of minutes practiced per day is along the vertical axis.
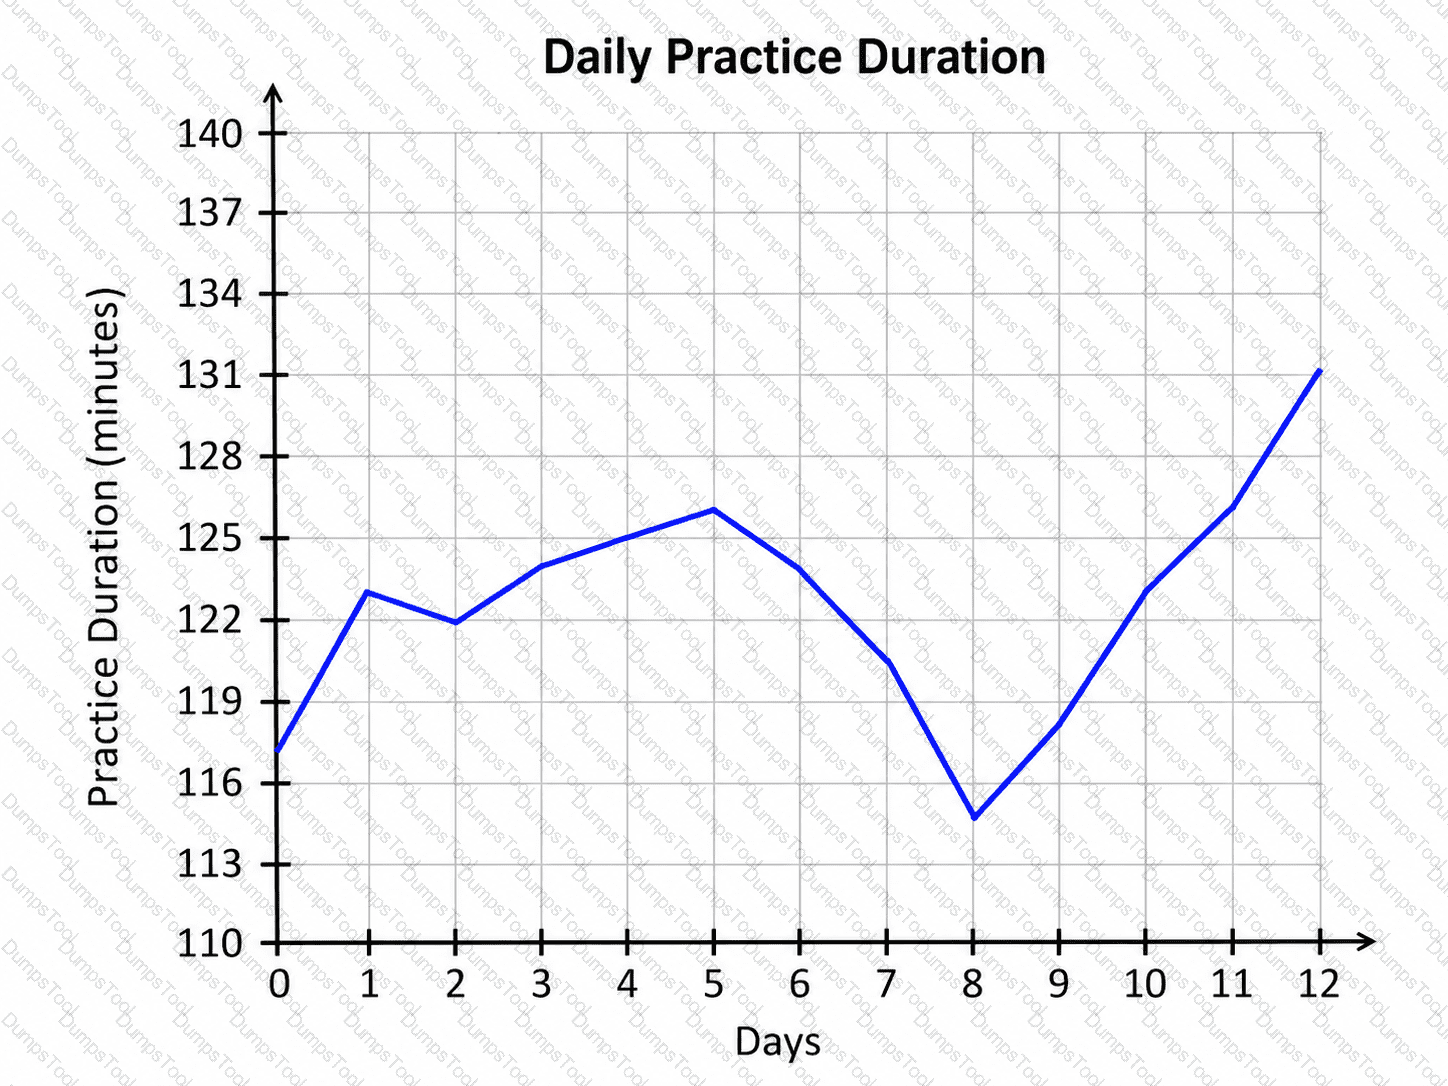
Based on the graph, what was the practice duration for day 8?
As sacks are unloaded off a wagon, the total weight of the wagon and sacks changes. Each sack has the same weight. After 5 sacks are removed, the total weight of the wagon and remaining sacks is 135 pounds. After 9 sacks are removed, the total weight is 87 pounds. What is the weight of each sack?
A new company just launched and is using the function M(t)to predict its market share after tyears. The graph of M(t)is shown.

When should the company expect to have a market share of 40%?
Consider the graph of x(t) shown. The function represents the number of users, x, watching a live video t hours after 9:00 a.m.

Which interval represents a range of values for which the number of users is decreasing slower and slower?
The number of acres affected by an invasive species can be modeled using the logistic function f(x), where xrepresents the number of months since the species was introduced and f(x)represents the number of affected acres. The graph of f(x)is shown.
What happens as time progresses from month 2 to month 6?
The data in the scatterplot represents the number of people working at a research station over time. The graphed regression function has an r
2
value of 0.96. The predicted number of people working at the research station after 18.1 years is 541.
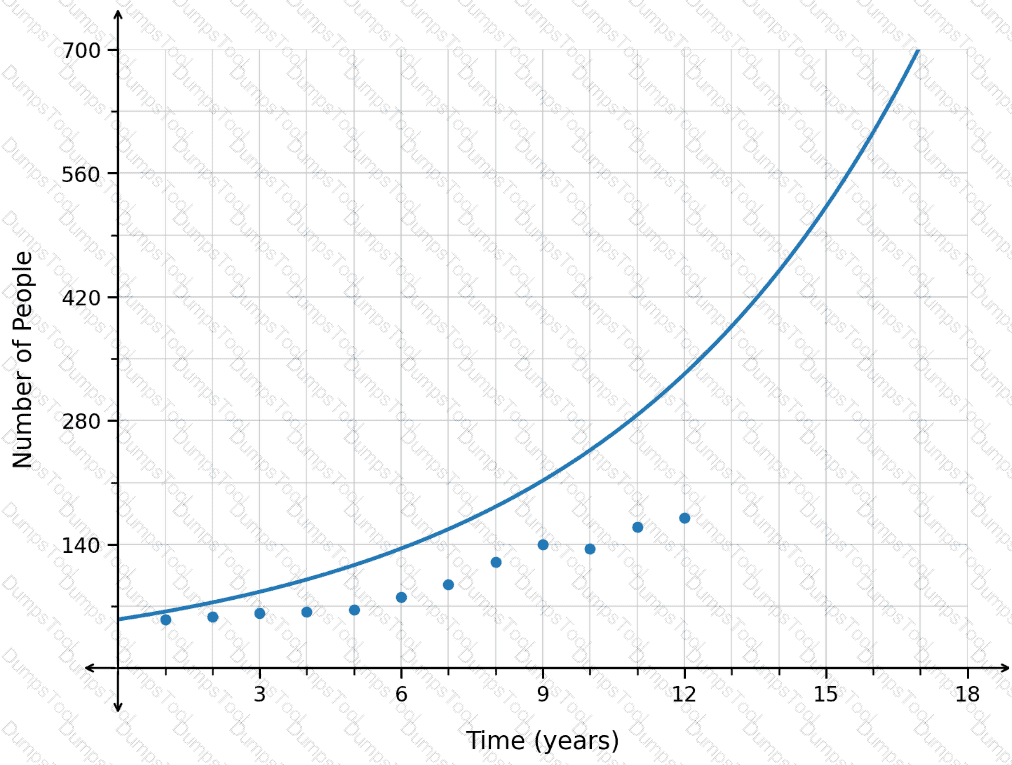
Is this prediction appropriate?
The data in the scatterplot represents the number of monthly train crossings at a particular intersection over time.
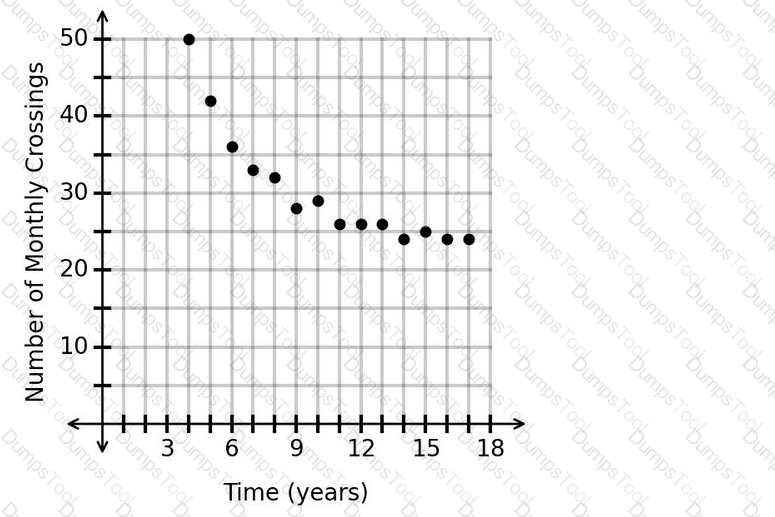
Which type of function should be used to model the data?
The function V(t)represents the number of travelers, V, in a travel depot thours after 7:00 a.m. The graph of V(t)is shown.
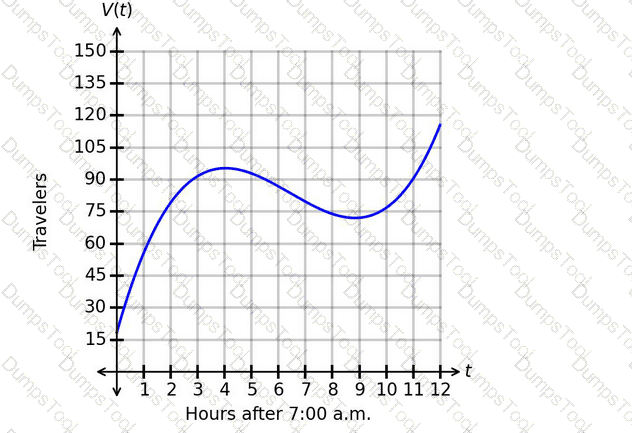
What does V(2)represent?
The graph shows the number of customers, C(t), showing up to a store, where the number of hours since opening is along the horizontal axis and the number of customers showing up to the store each hour is along the vertical axis.
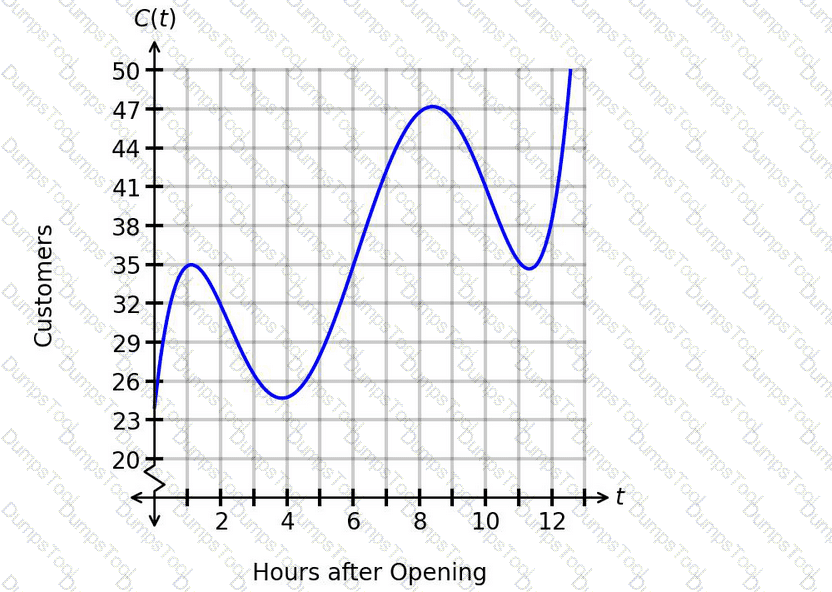
How can the concavity be described from t=6.2to t=10.1?
The function P(t)represents the yearly profit, in millions of dollars, for a streaming service since opening. The graph of P(t)is shown.
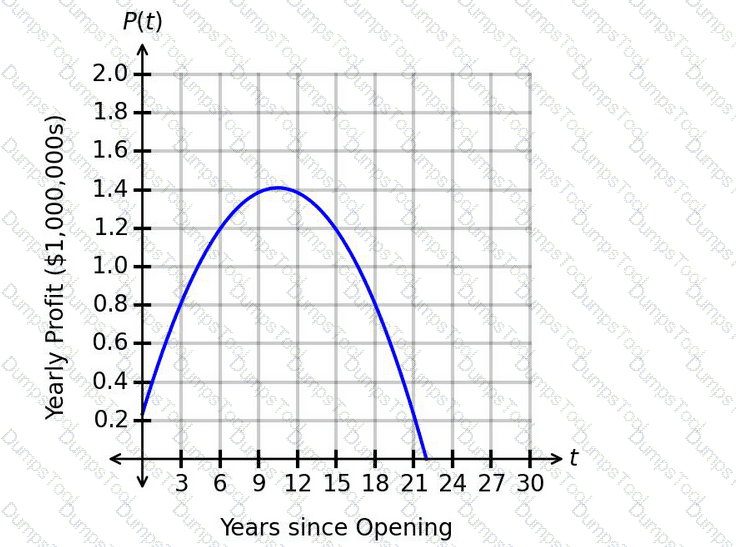
What is the correct interpretation of the maximum value?
In the following graph showing the elevation profile, F(d), for a mountain biking course, the horizontal axis shows the number of miles since the start of the course and the vertical axis shows the elevation in feet.
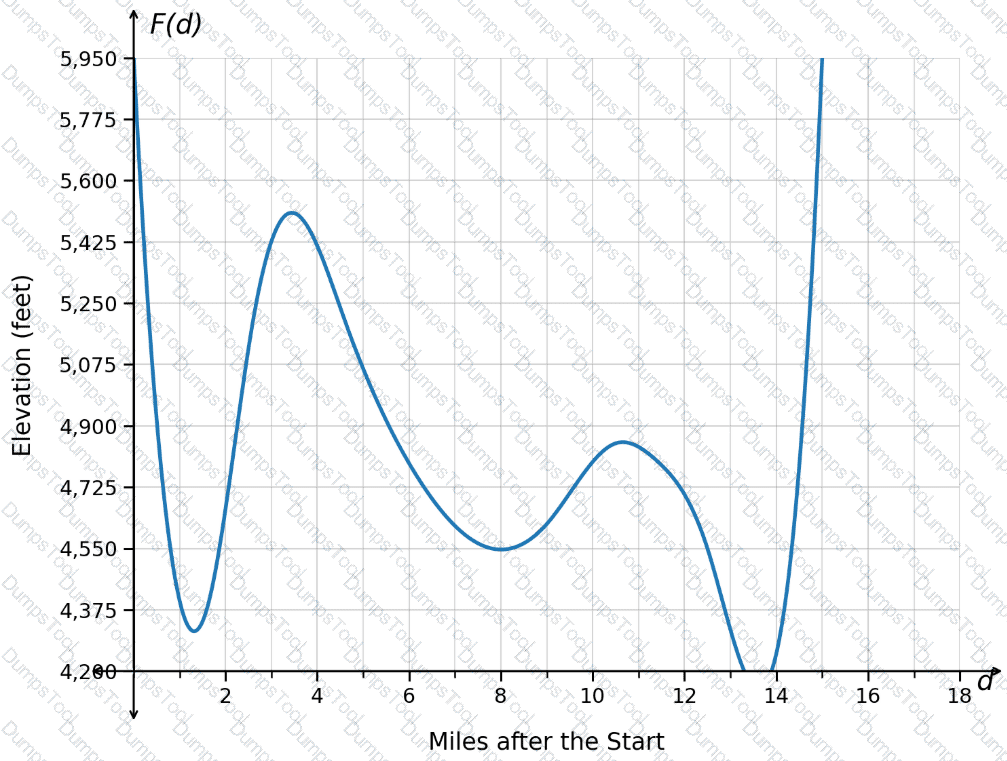
How can the concavity be described from d=10 to d=13.1?
The graphed function v(t) represents the number of vehicles, v, stopped at a toll booth t hours after 6:00 a.m. The coordinates of points A and B are (1,49.4) and (4,45.8), respectively.
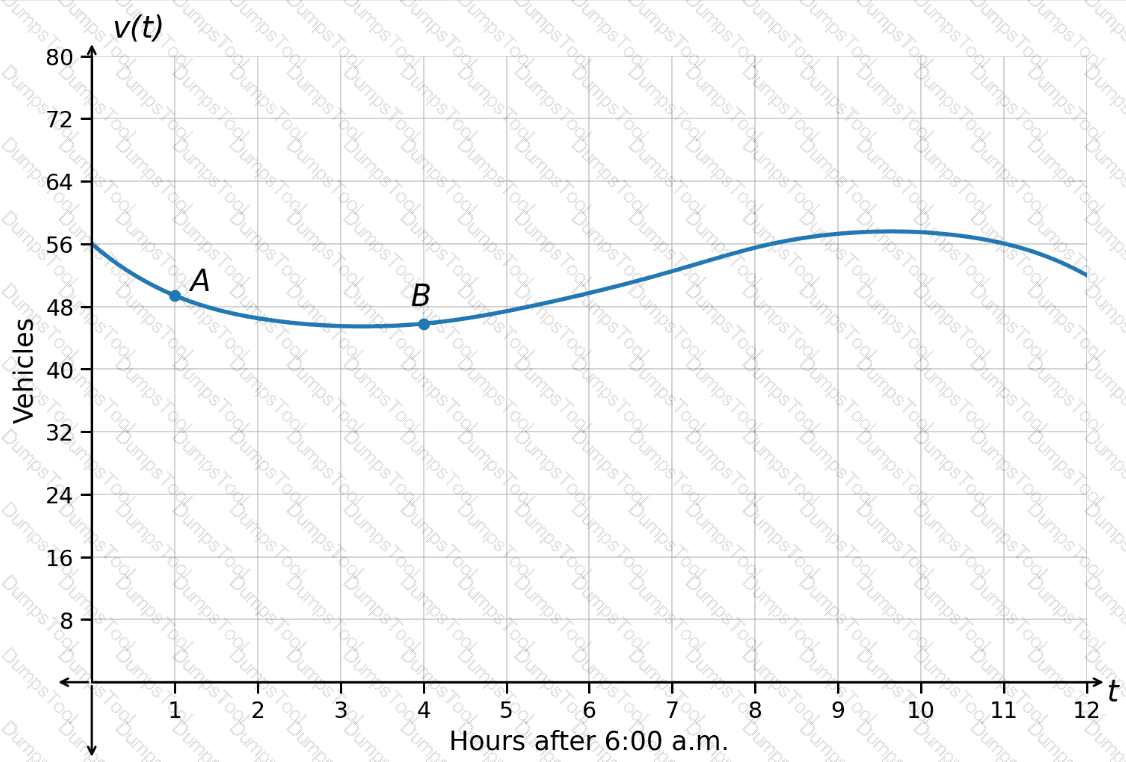
What is the average rate of change of the number of vehicles from point A to point B?
The number of people auditioning for a game show is expected to be 4 times the number of people who auditioned last year. The function A(t) can be used to model the situation, where t represents the number of people who auditioned last year and A represents the number of people expected to audition this year.
Which quantity represents the number of people expected to audition this year, given that 330 people auditioned last year?
An investment account accrues interest every year, and the value of the account is given by G(x). The graph of this function is shown.
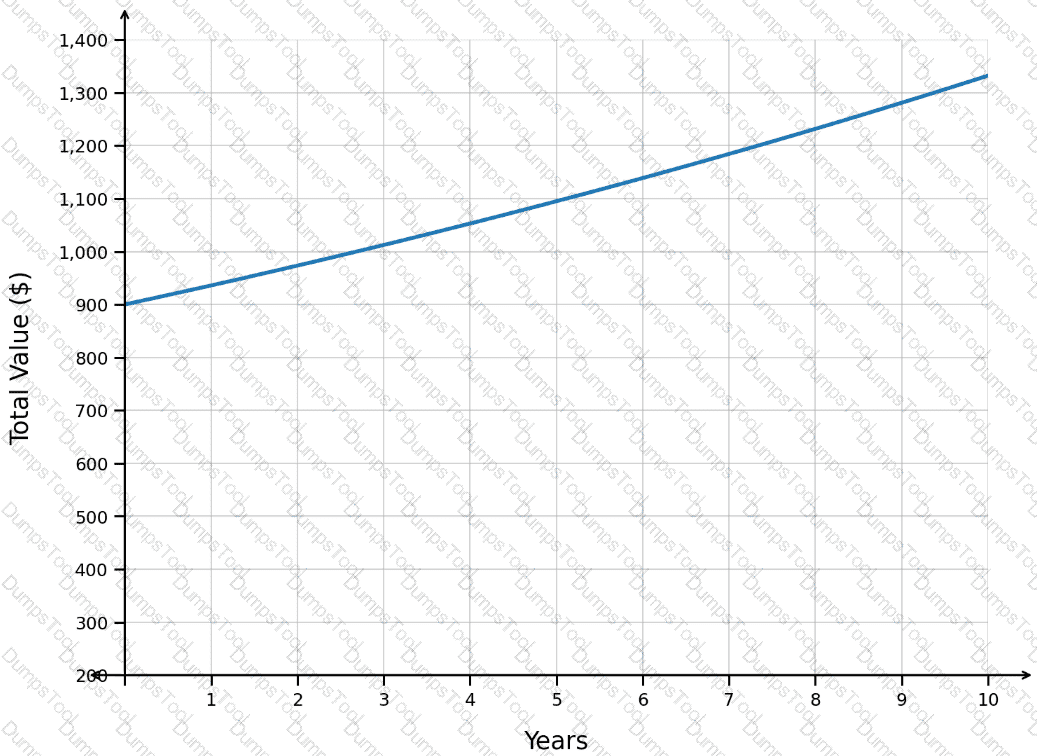
What represents the value of the account after 4 years?
The graphed function n(t)represents the number of people, n, at a park thours after 8:00 a.m. The plotted points Aand Bhave coordinates (2│110)and (6│182).
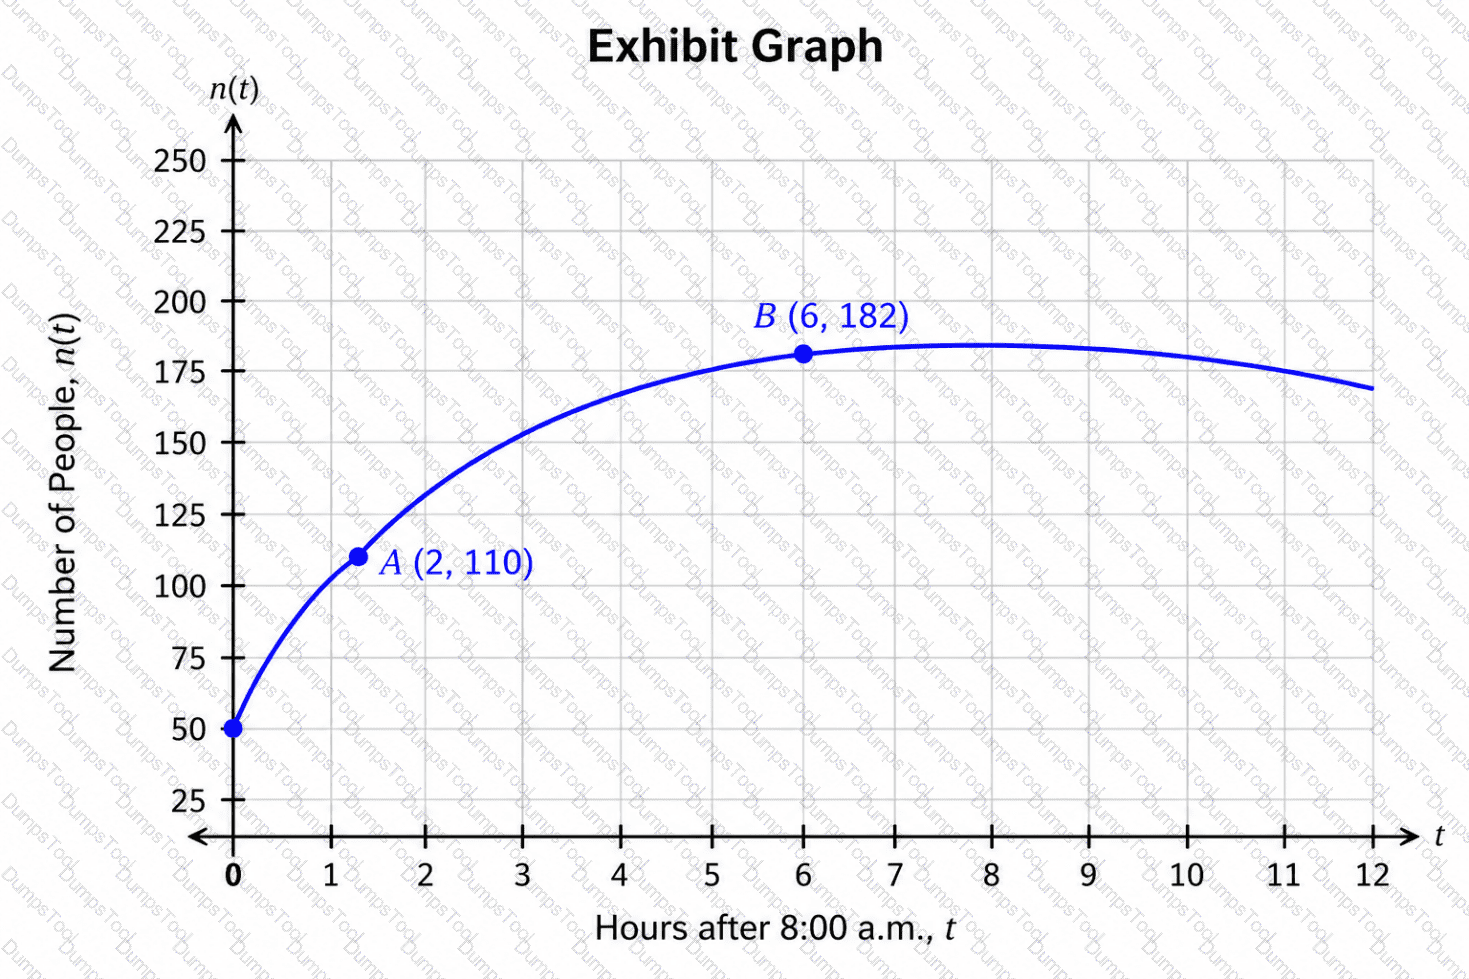
Which statement gives the correct interpretation of the average rate of change of the number of people over the interval from point Ato point B?
A music student attempted to learn a difficult new song. Each day, the student would play the song and be scored on their performance. The graph shows the results.
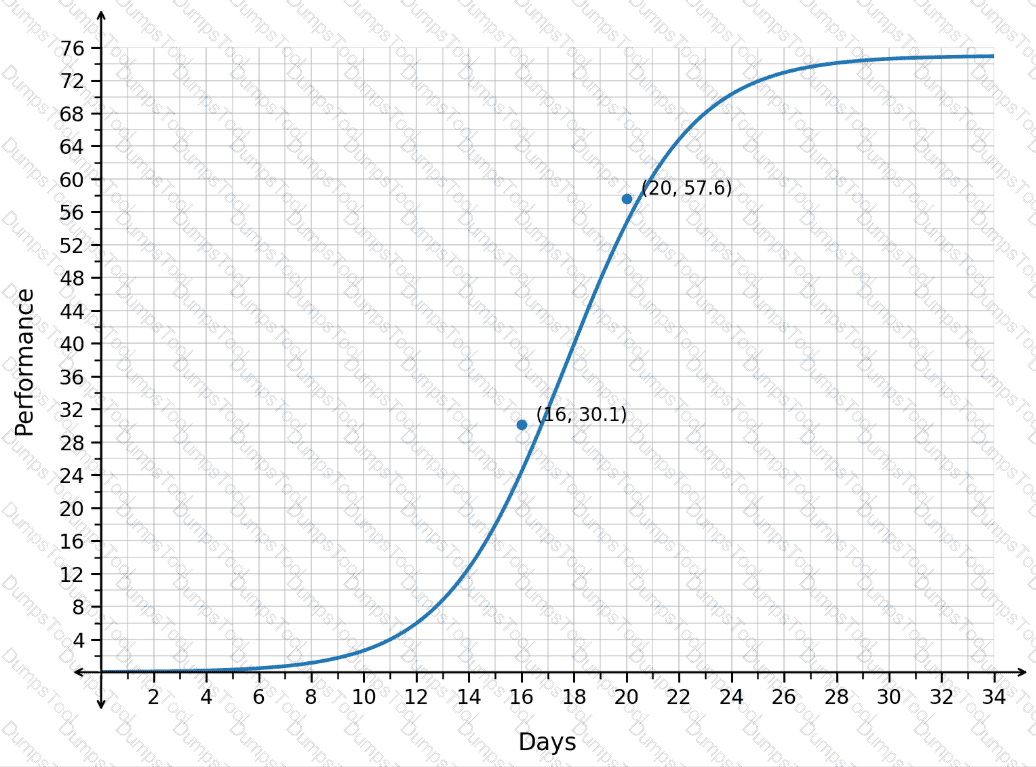
What was the average daily change in performance from day 16 to day 20?
The spread of two viruses within a single population is modeled using the functions in the graph.
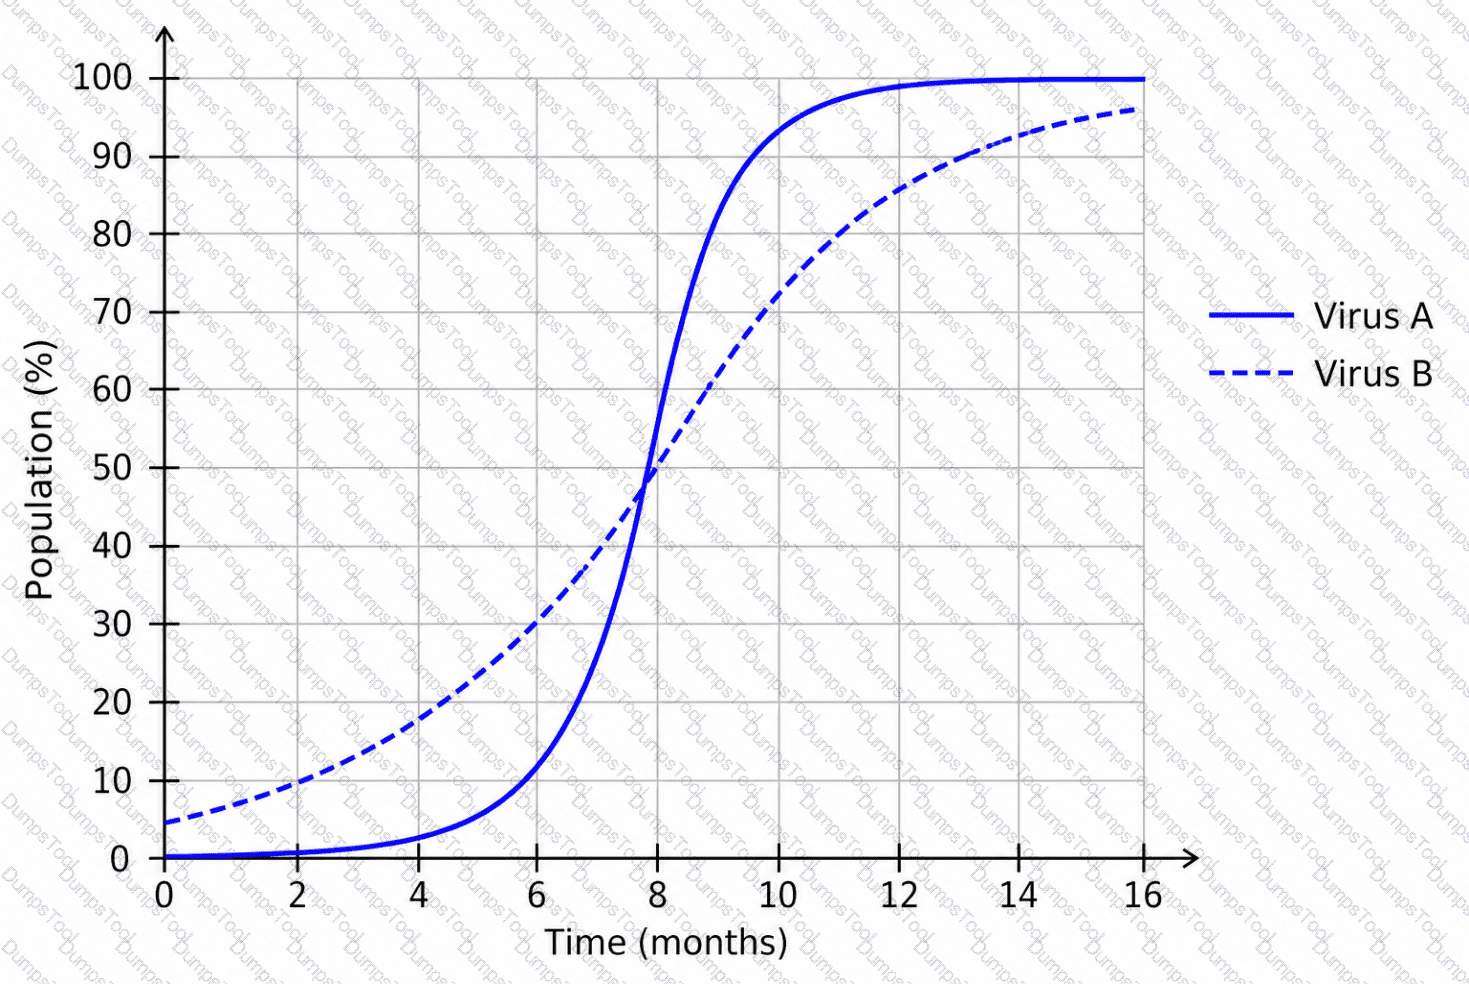
What is a correct conclusion based on the graph?
The graph shows the number of customers visiting a bookstore, where the number of days since the beginning of the month is along the horizontal axis and the number of customers visiting the bookstore each day is along the vertical axis. More customers show up to the store on days when new releases are featured than on other days.
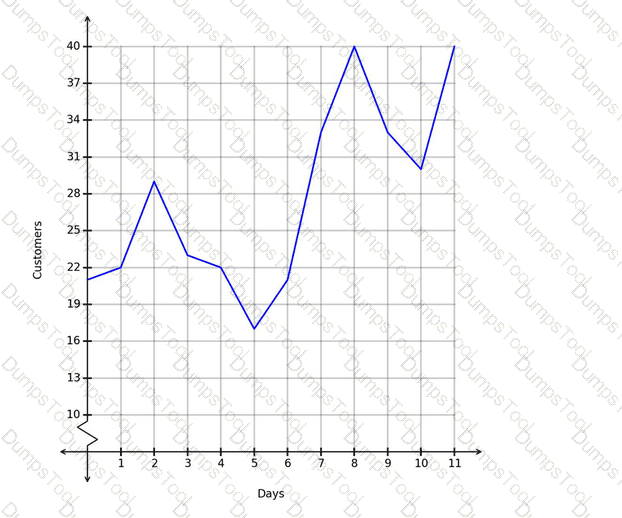
Which days likely featured new releases?
The graph shows the estimated wait time, in minutes, based on the number of hours after 7:00 a.m.
What is the average rate of change of the wait time from point Ato point B?
The function F(n) represents the relationship between the number of animals in two enclosures, where n is the number of animals in enclosure A and F is the number of animals in enclosure B. The number of animals in enclosure B is 20 more than the number of animals in enclosure A.
Which function represents this situation?
The graph shows the total cost of a lumber delivery based on the number of identical boards ordered.
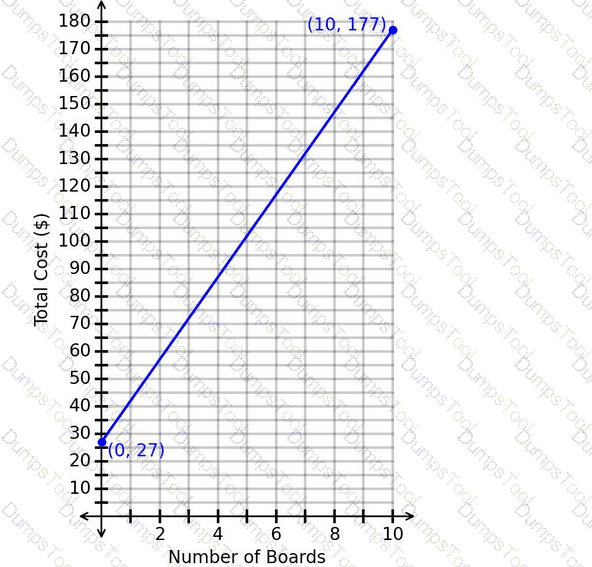
What is the cost of each additional board?
The value of a collectible artifact is represented by the function
f(x)=330× 〖 1.15 〗 ^x
In this function, xrepresents the number of years since 2005, and f(x)represents the value of the artifact, in dollars.
Which value represents the average yearly rate of change of the value of the artifact from 2006 to 2011?
The number of letters processed daily at a mail center is modeled by the decreasing exponential function shown in the graph.
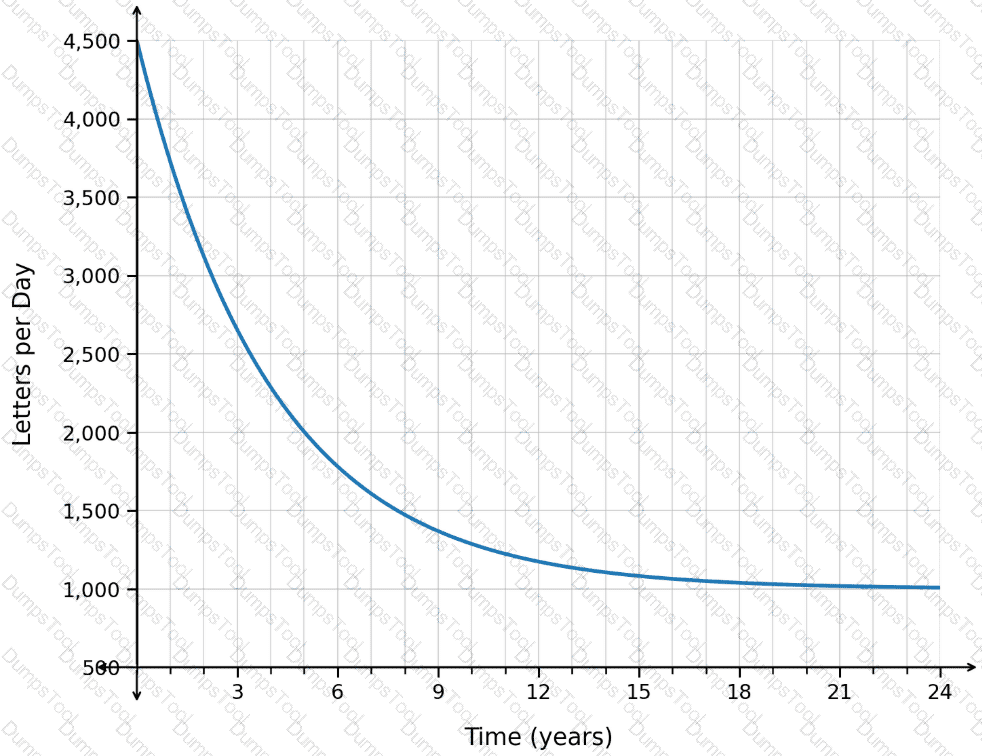
What is the long-term trend in the number of letters processed per day, based on the equation of the horizontal asymptote?
Consider the function
w(t)=0.03t^4-0.81t^3+7.55t^2-26.62t+44
which represents the number of workers, w, at a job site thours after 6:00 a.m.
What is the difference between w(4)and w(8)?
A researcher collected data on the number of annual bear sightings in a region over time. The results are shown in the scatterplot. A regression function is graphed with r^2=0.42. The predicted number of annual bear sightings after 19.5years is 62.2.
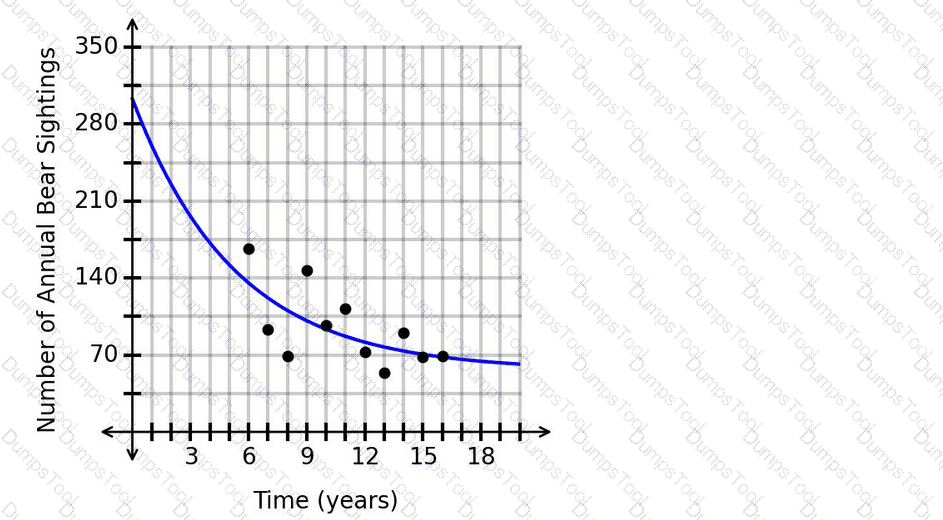
Is this prediction appropriate?
A new company just launched and is using the function M(t)to predict its market share after tyears. The graph of M(t)is shown.
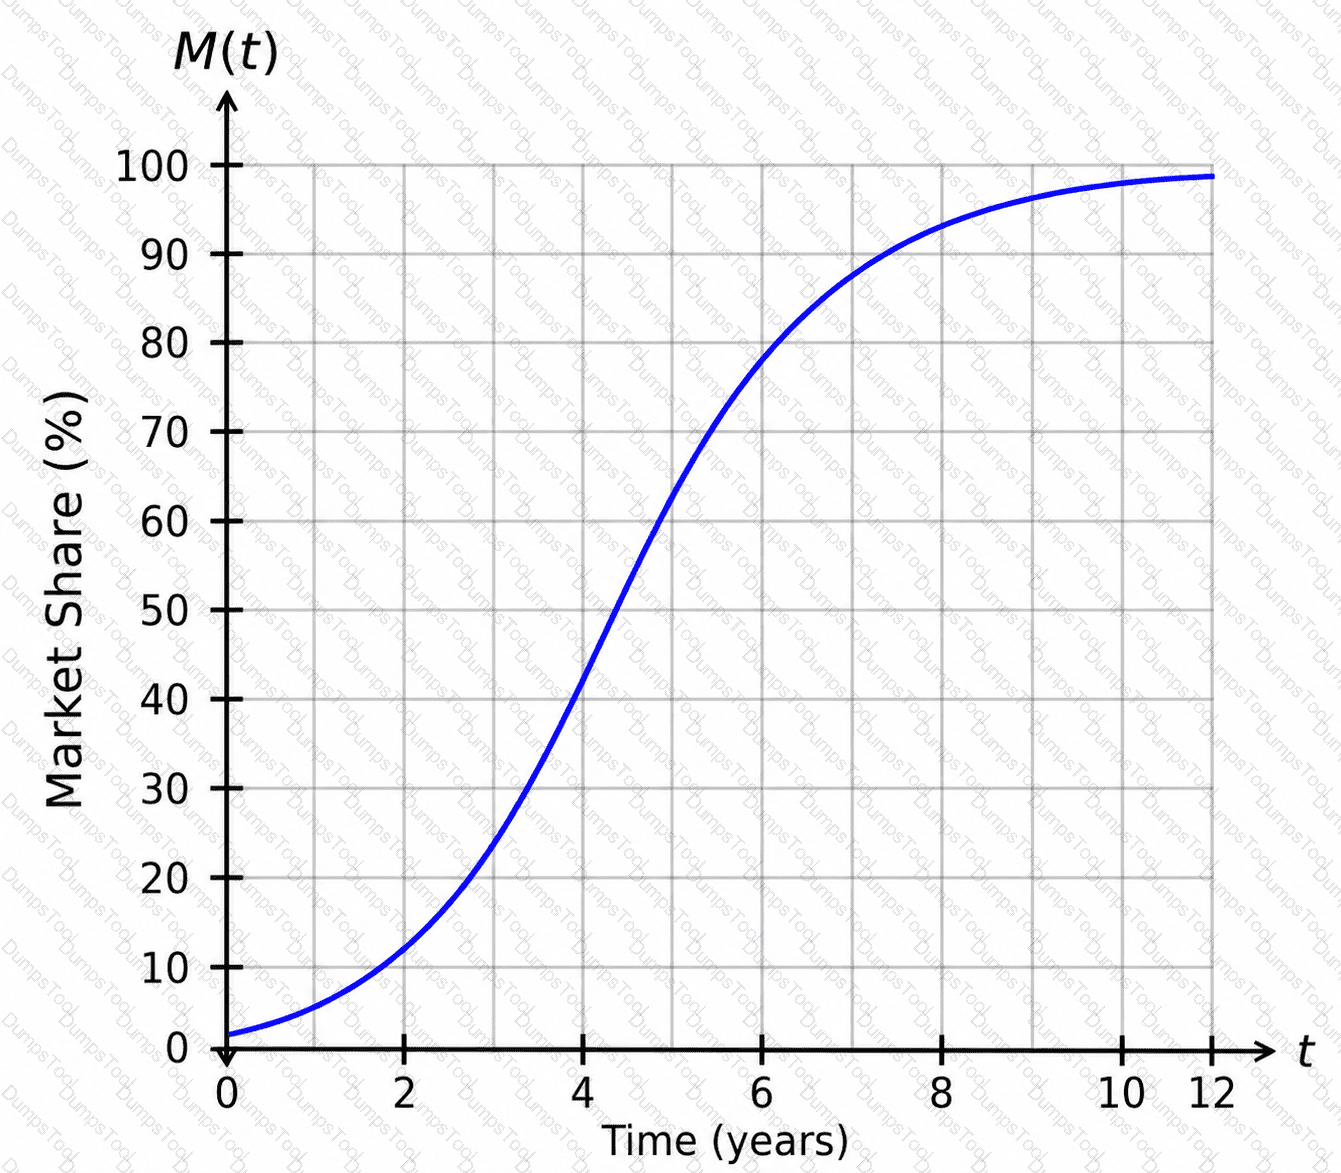
When should the company expect to have a market share of 60%?
The number of daily raffle tickets sold, R(d), for a fundraiser is represented by the graph, with the number of days since the beginning of the month along the horizontal axis and the number of raffle tickets sold for the day along the vertical axis.
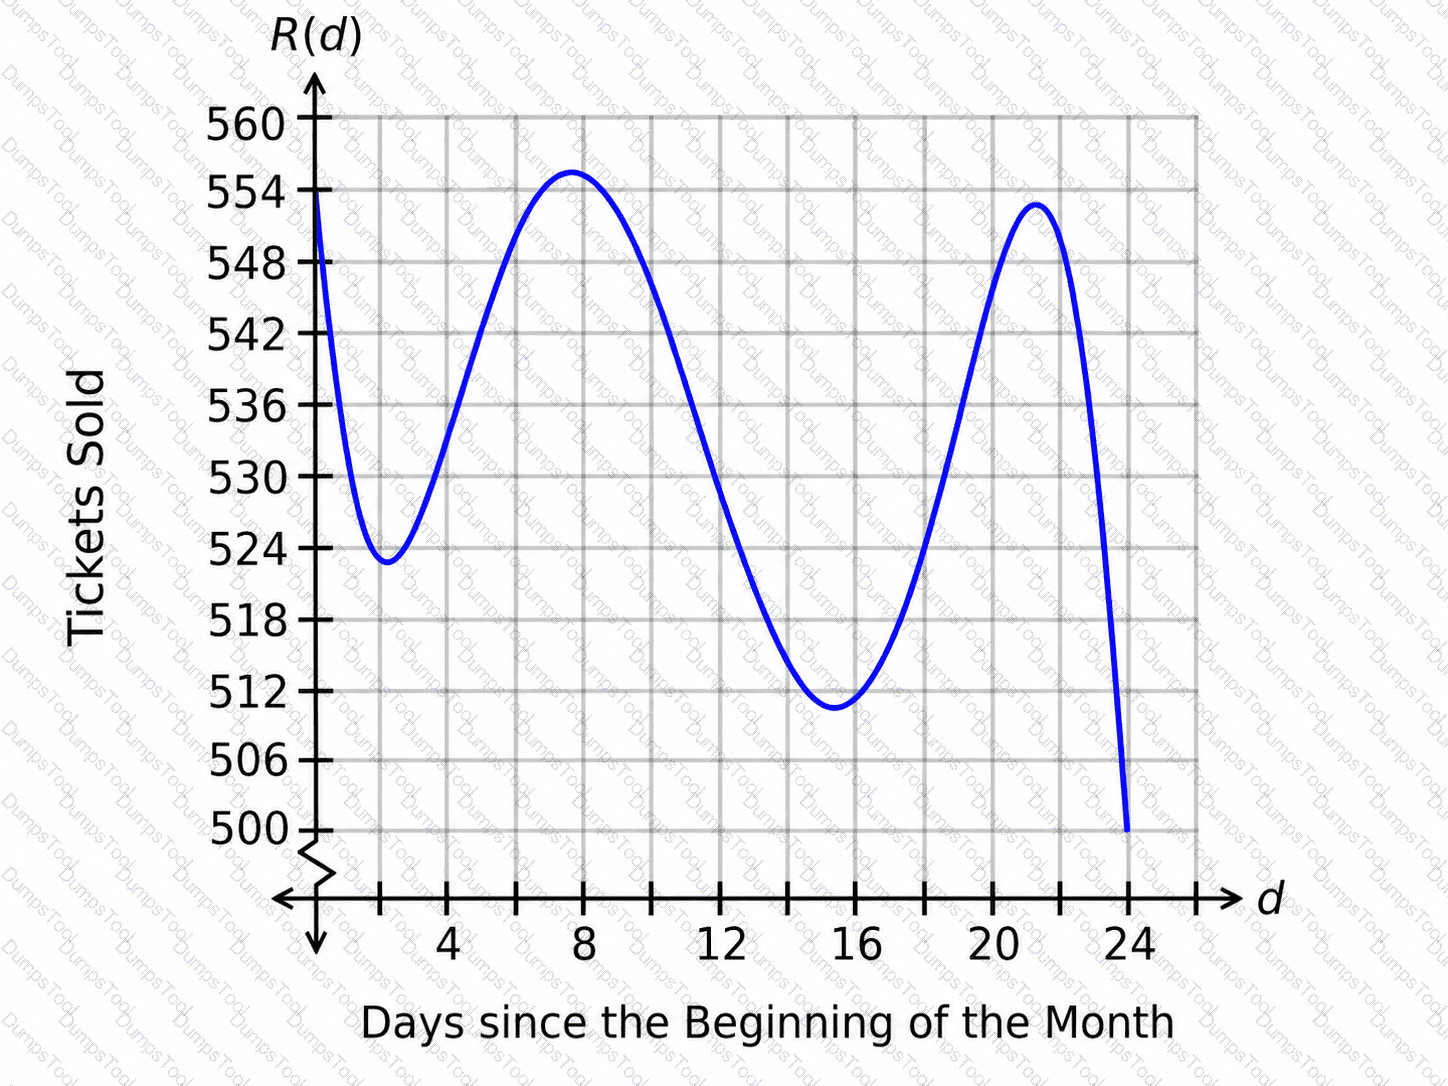
How can the concavity be described from d=0to d=4.4?
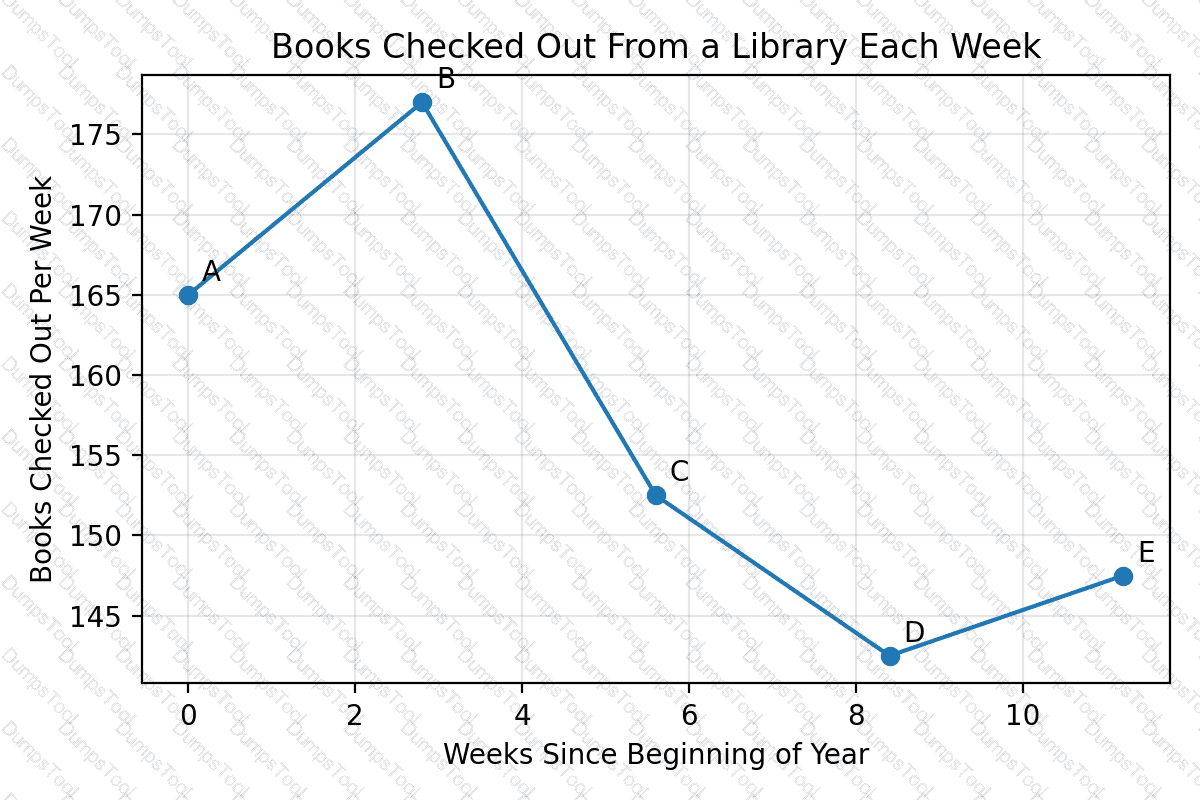
The graph shows the number of books, N, checked out from a library each week. The number of weeks since the beginning of the year is on the horizontal axis, and the number of books checked out per week is on the vertical axis. Point A represents 165 books checked out in the first week, or N(0)=165. Which statement represents an accurate conclusion?
Exhibit:
The number of people auditioning for a game show is expected to be 7 more than the number of people who auditioned last year. The function A(t) can be used to model the situation, where t represents the number of people who auditioned last year and A(t) represents the number of people expected to audition this year. Which quantity represents the number of people expected to audition this year, given that 440 people auditioned last year?
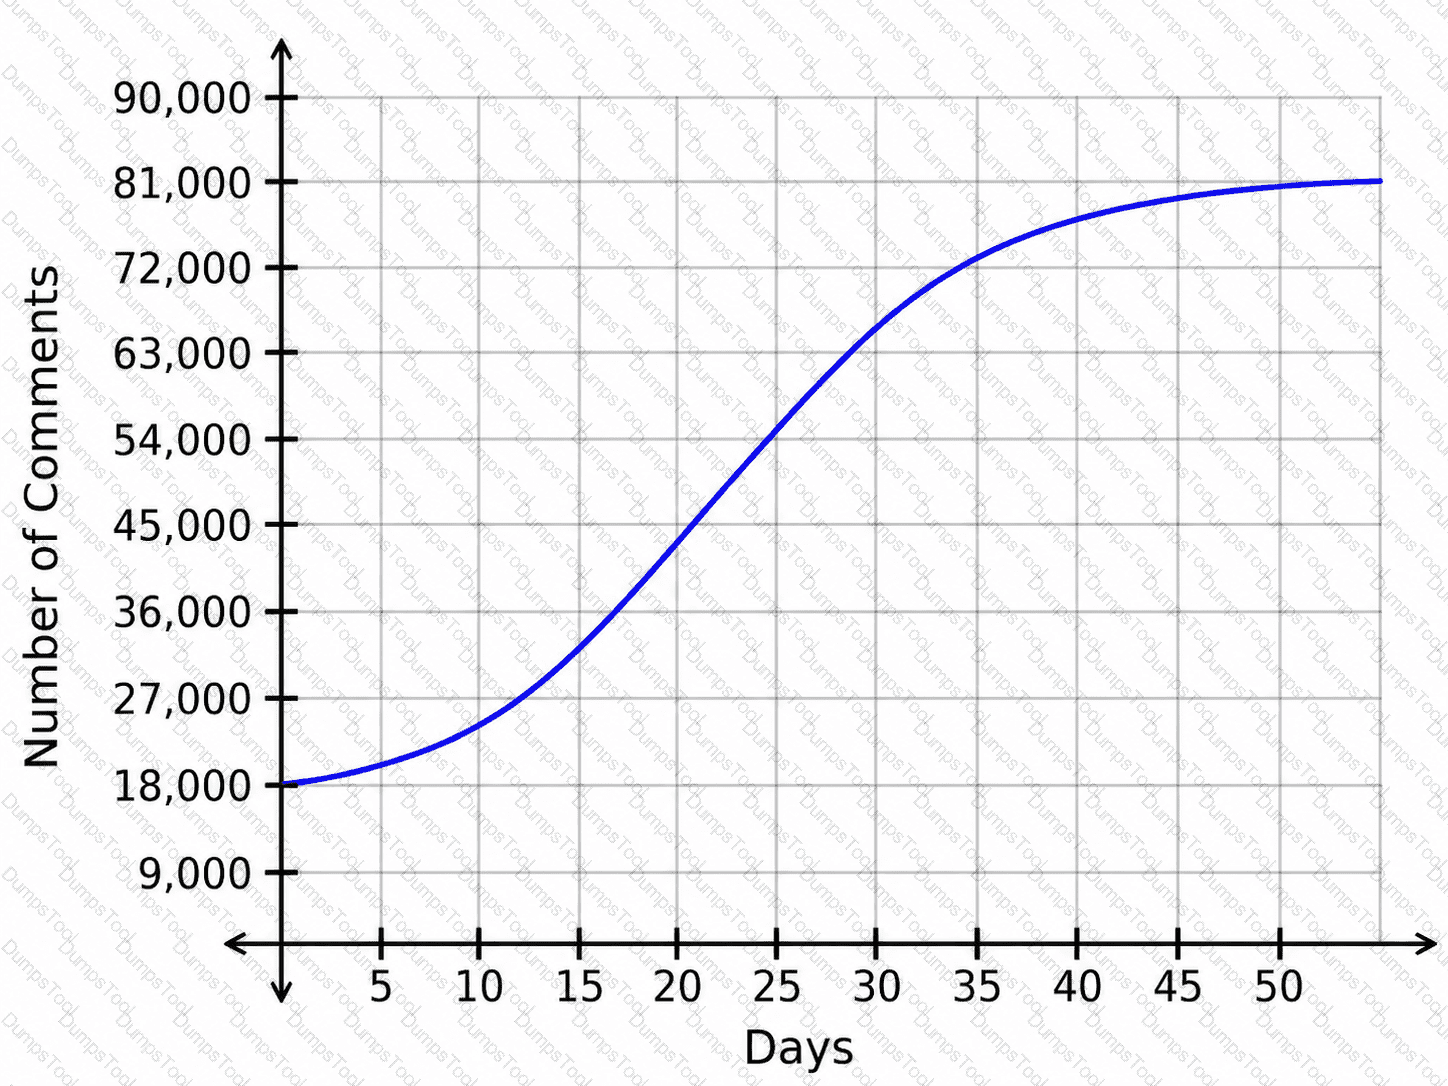
The number of comments on a social media post is represented by the logistic function f(x), whose graph is shown, where xrepresents the number of days since the post was created and f(x)represents the number of comments on day x.
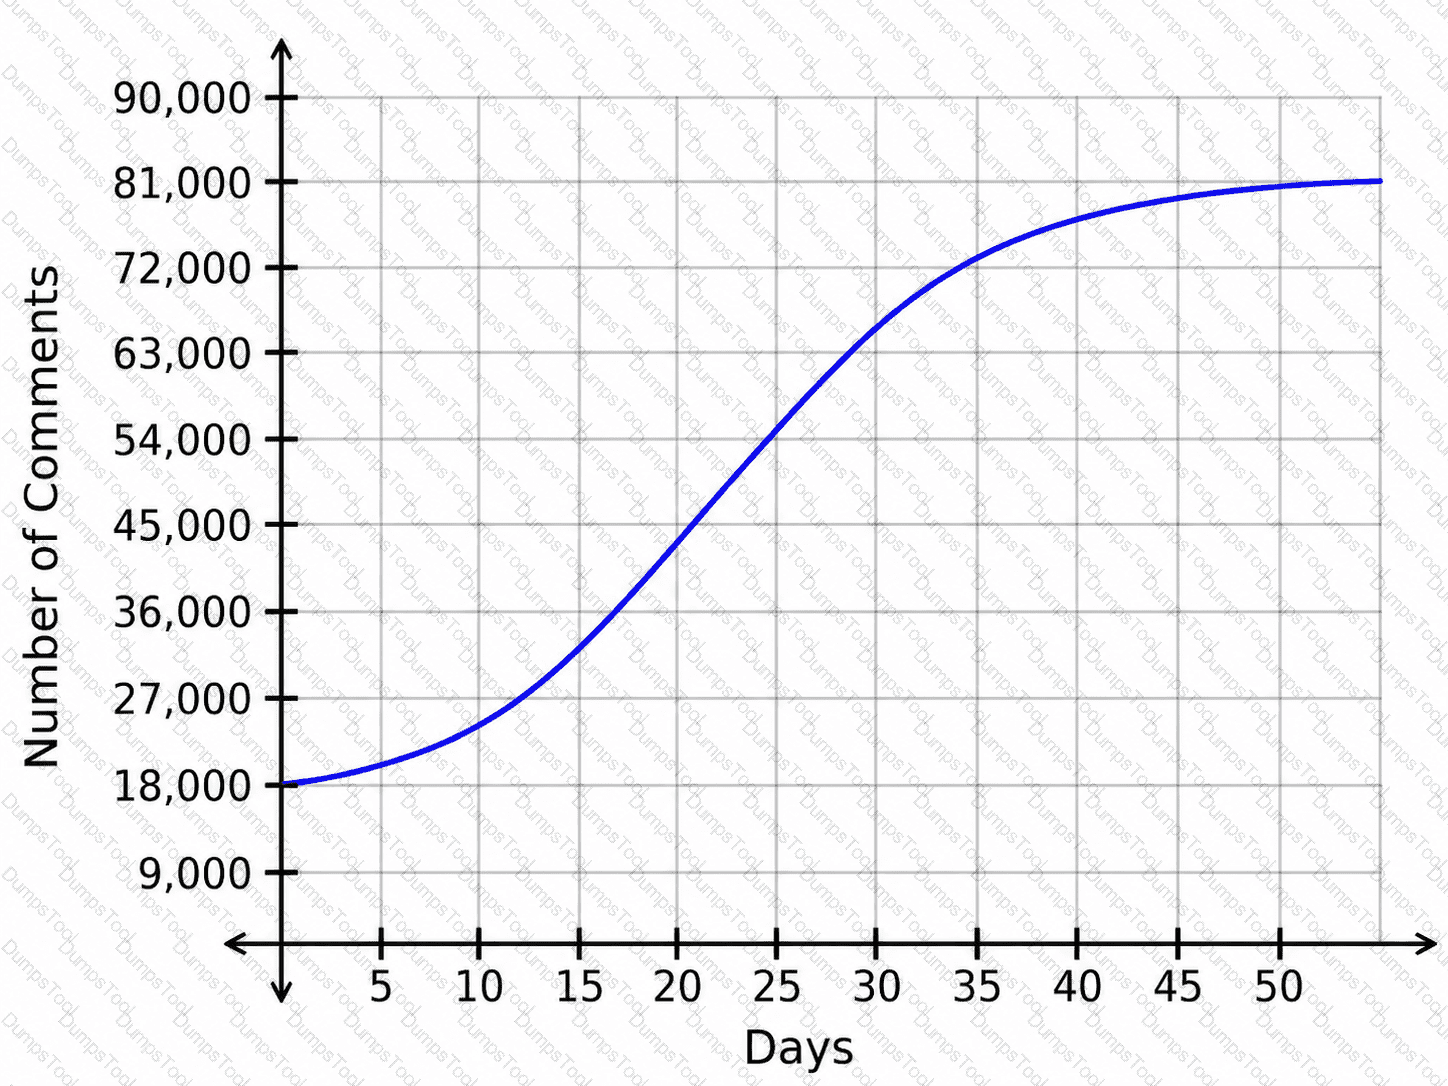
How does the number of comments change as time progresses from day 1 to day 17?
The logistic function f(x), whose graph is shown, models the number of registrants for an academic conference, where xrepresents the number of weeks since registration opened and f(x)represents the number of registrants.
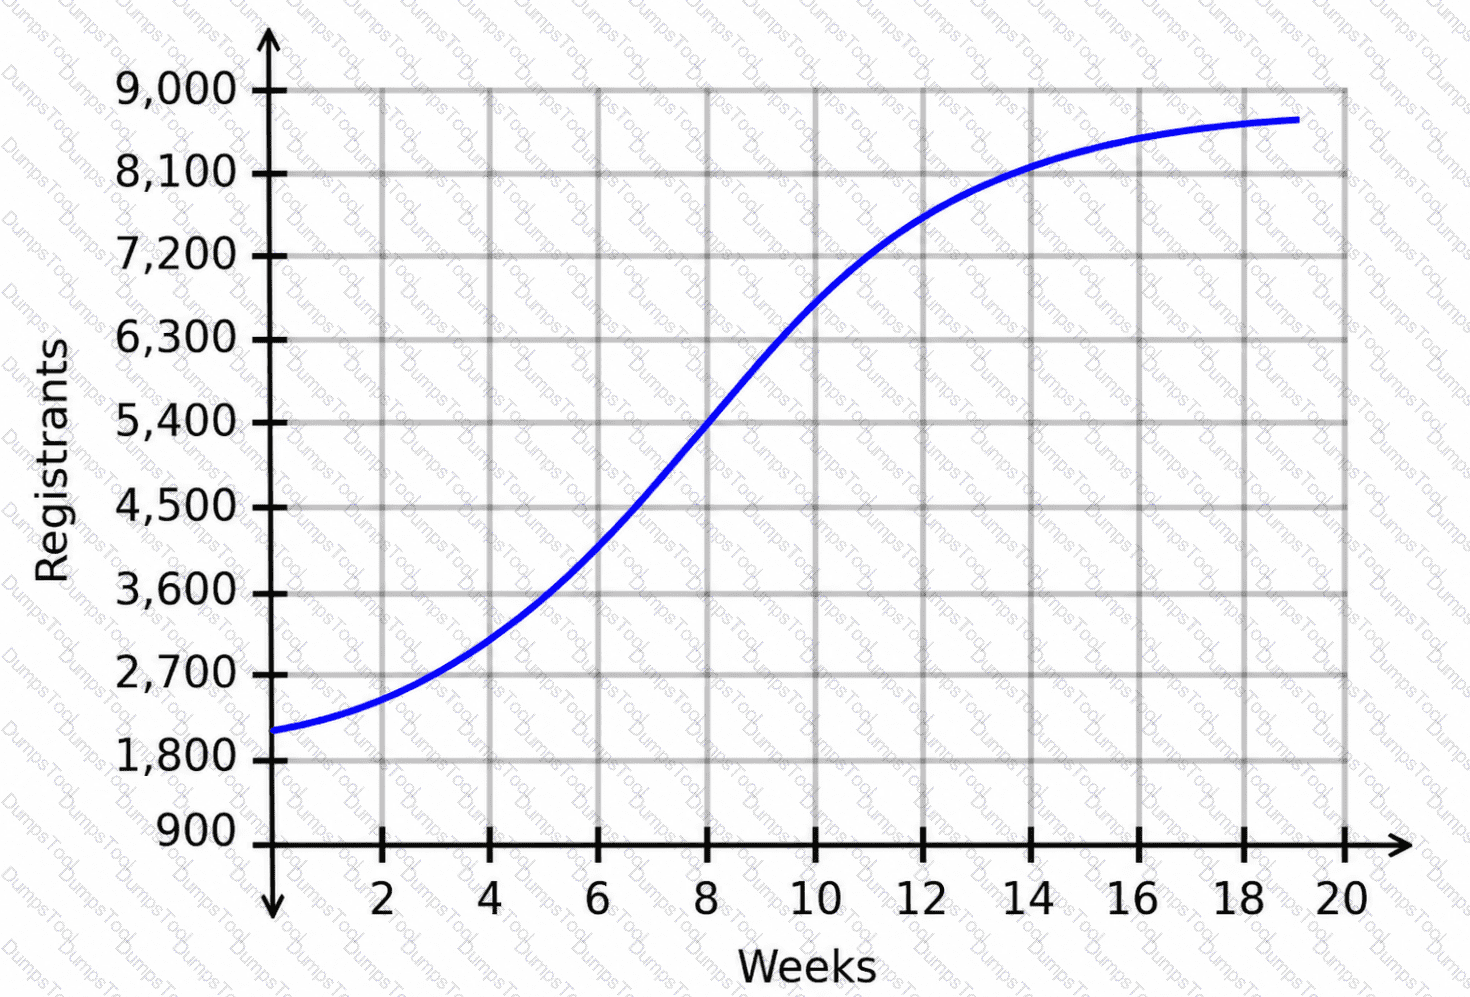
How does the number of registrants change as time progresses from week 1 to week 7?
The figure displays the graphs of two functions representing the heights, h_1and h_2, in feet, of two balls tseconds after being launched.
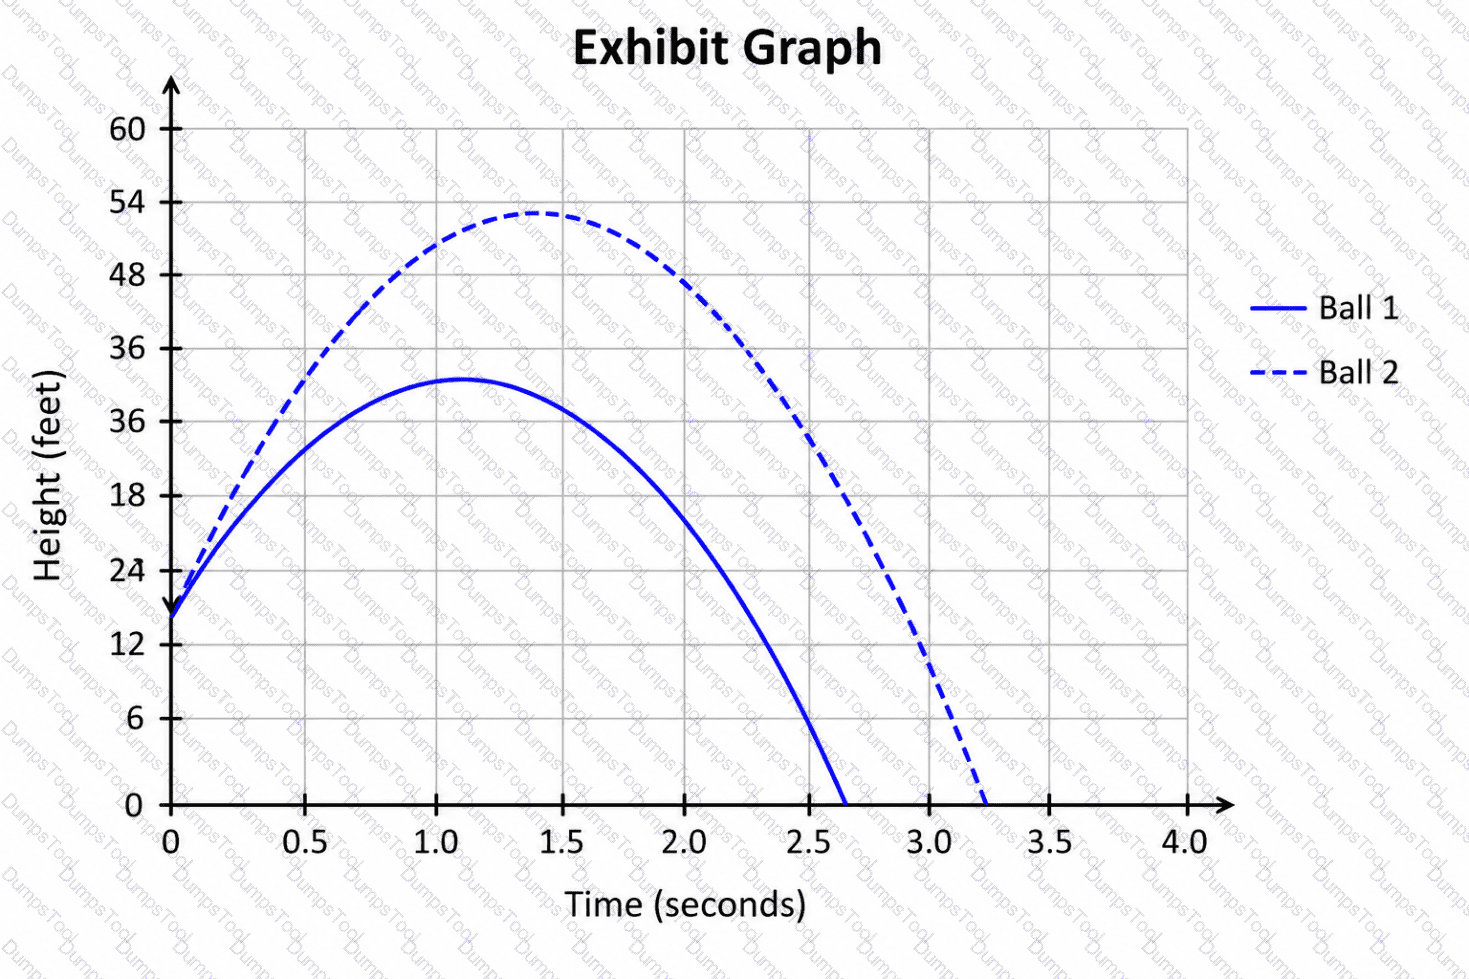
Which ball was lower 0.9seconds after being launched?
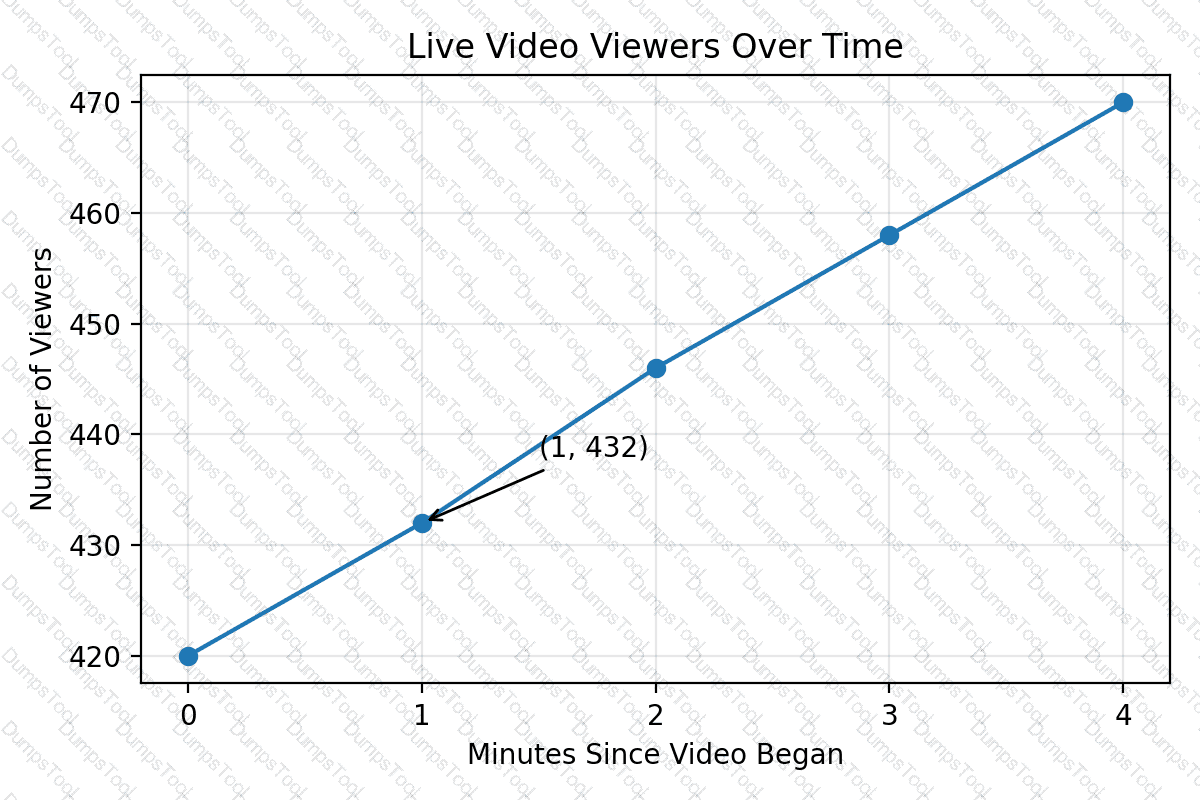
The graph shows the number of people watching a live video. The number of minutes since the video began is on the horizontal axis, and the number of viewers is on the vertical axis. When were there 432 viewers?
Exhibit:
The graph shows the value, O, in dollars, of an investment account over time.
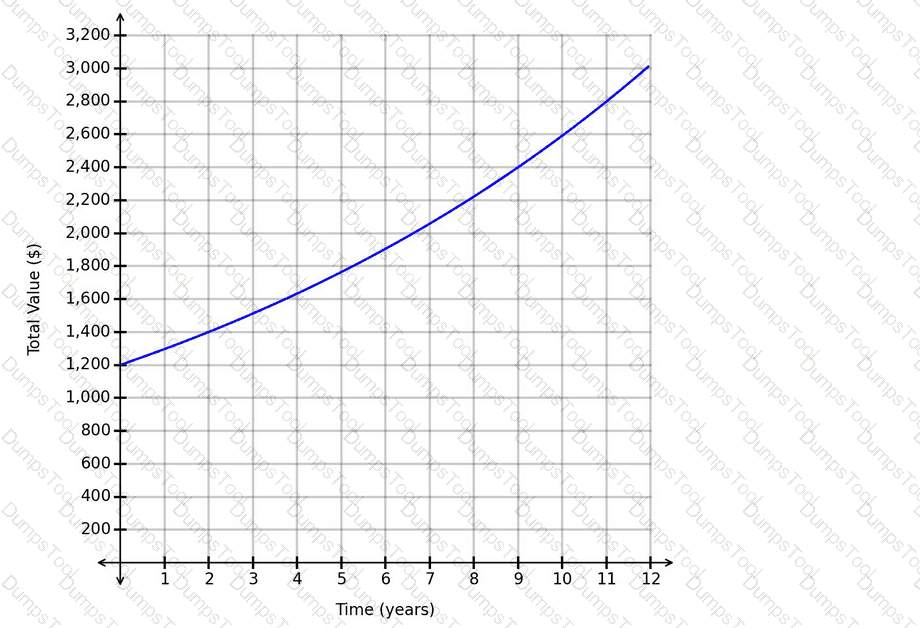
What represents the value of the account after 8 years?

TESTED 06 Oct 2026