Beginning in version 10.5, when you create a new extract, it uses the _________ format instead of the .tde format.
You need to display the complete list of potential data connections when you connect to a server. What action should you perform?
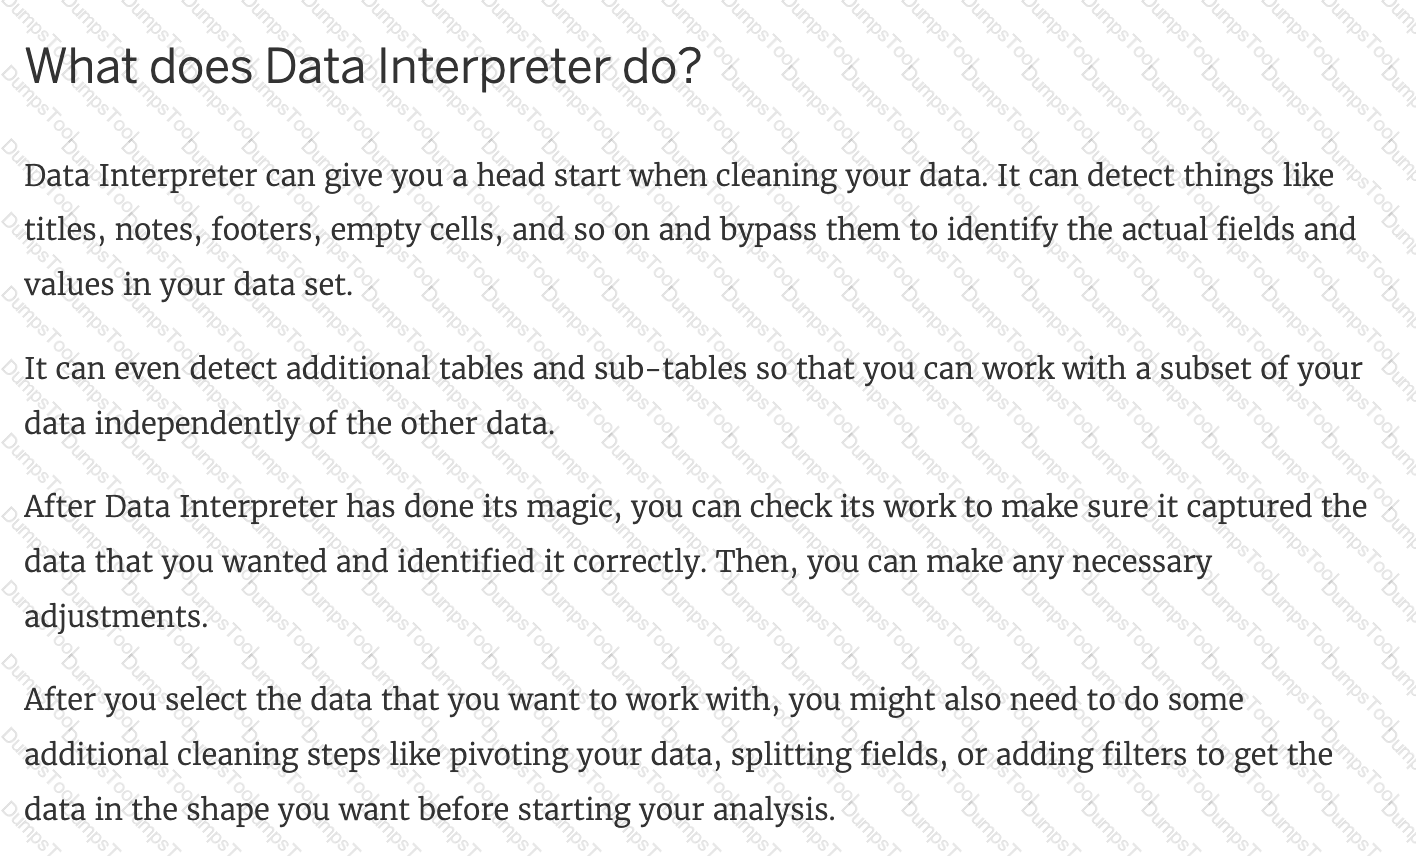
You can use the __________________ in Tableau to clean / organise your data.
Dimensions containing ____________ and ____________ values cannot be continuous.
You want to save a view as an image that you can paste into a Microsoft Word document. Which two statements accurately describe exporting a view as an image? Choose two.
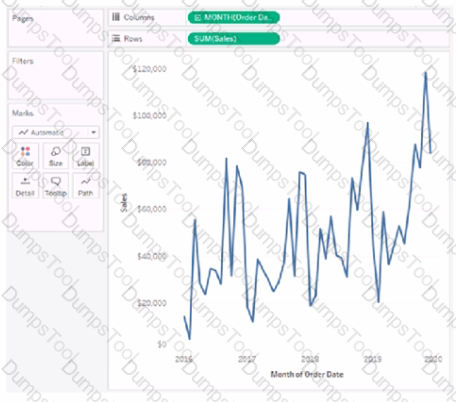
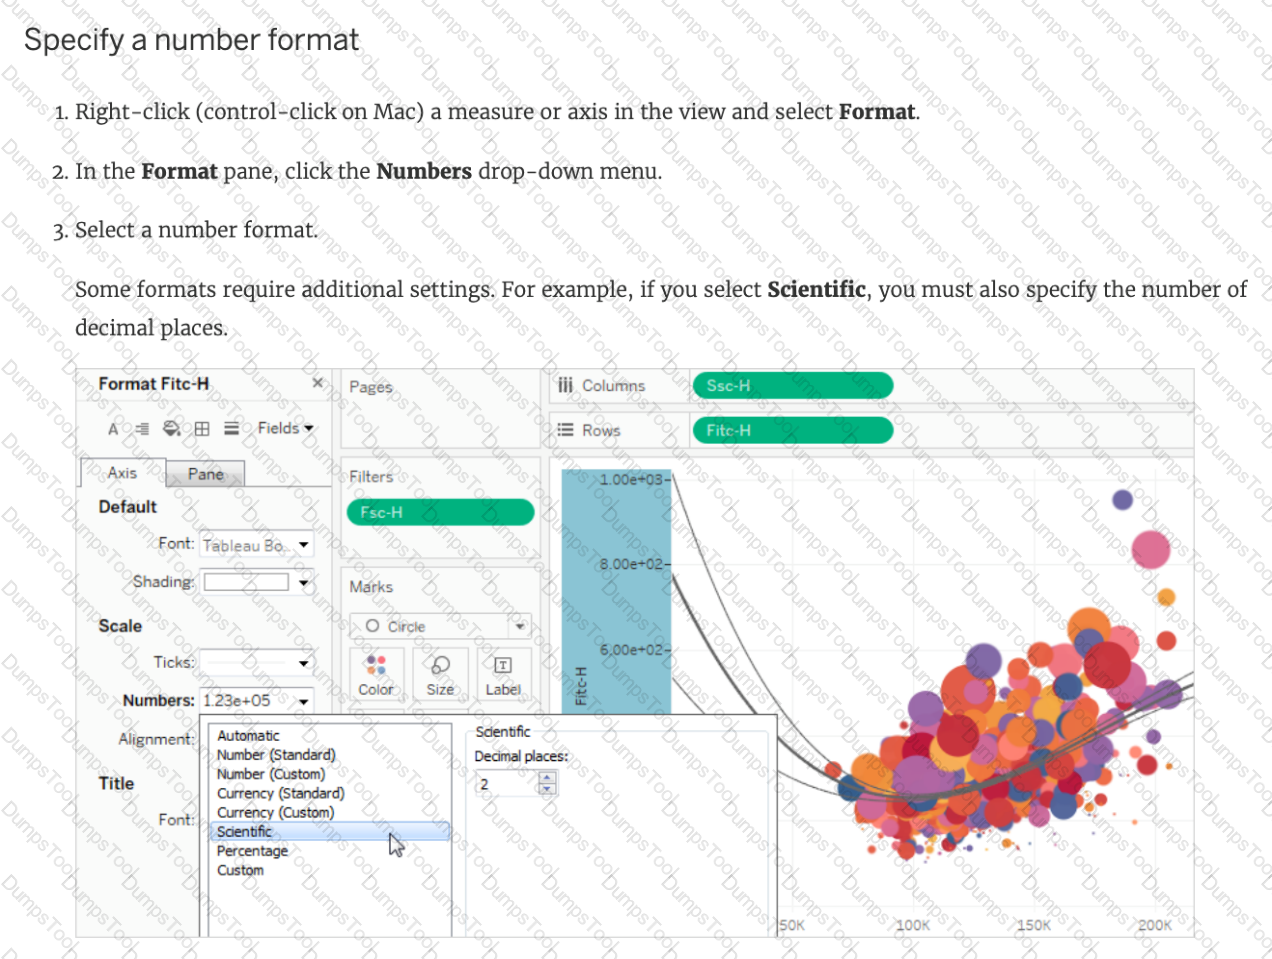
You have the following visualization.
You need to show how Internet Usage values change from year-to-year as a percentage. Which quick table calculation should you apply to the Internet Usage field?
Which aggregation is available without requiring a table calculation or calculated field?
You want to add Custom shapes to your visualisation. Where can you add these new shapes?
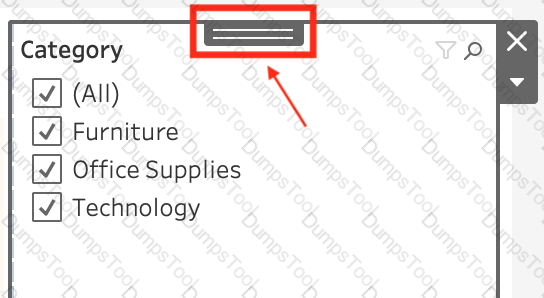
If you have a dashboard and are displaying its filter, how can you rearrange it?
Which two options can you use to change the device layout of a dashboard? Choose two.
Which three statements accurately describes the capabilities of dashboard actions? Choose three.
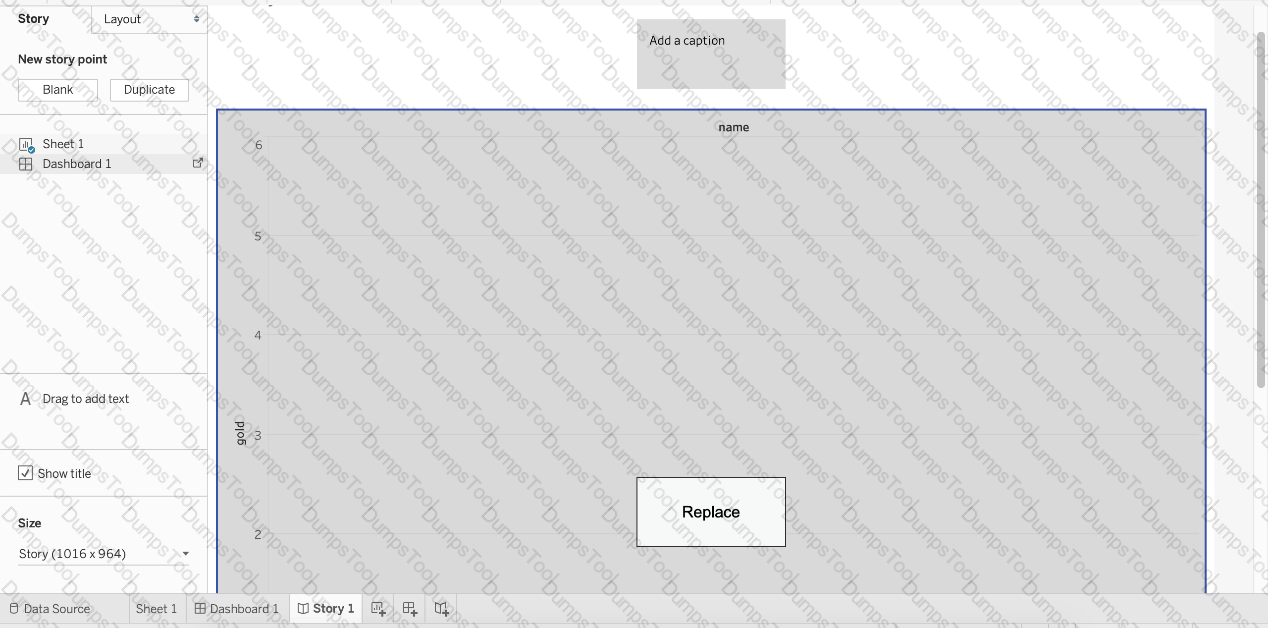
Is it possible to add both a Dashboard and a Worksheet at the same time to a Story Point in Tableau?
Which statement accurately describes creating a group by selecting headers in a view?
Which two actions can you perform when you join tables from multiple connections? Choose two.
When using a Blend, what is the color of tick-mark on the primary and secondary data sources respectively?
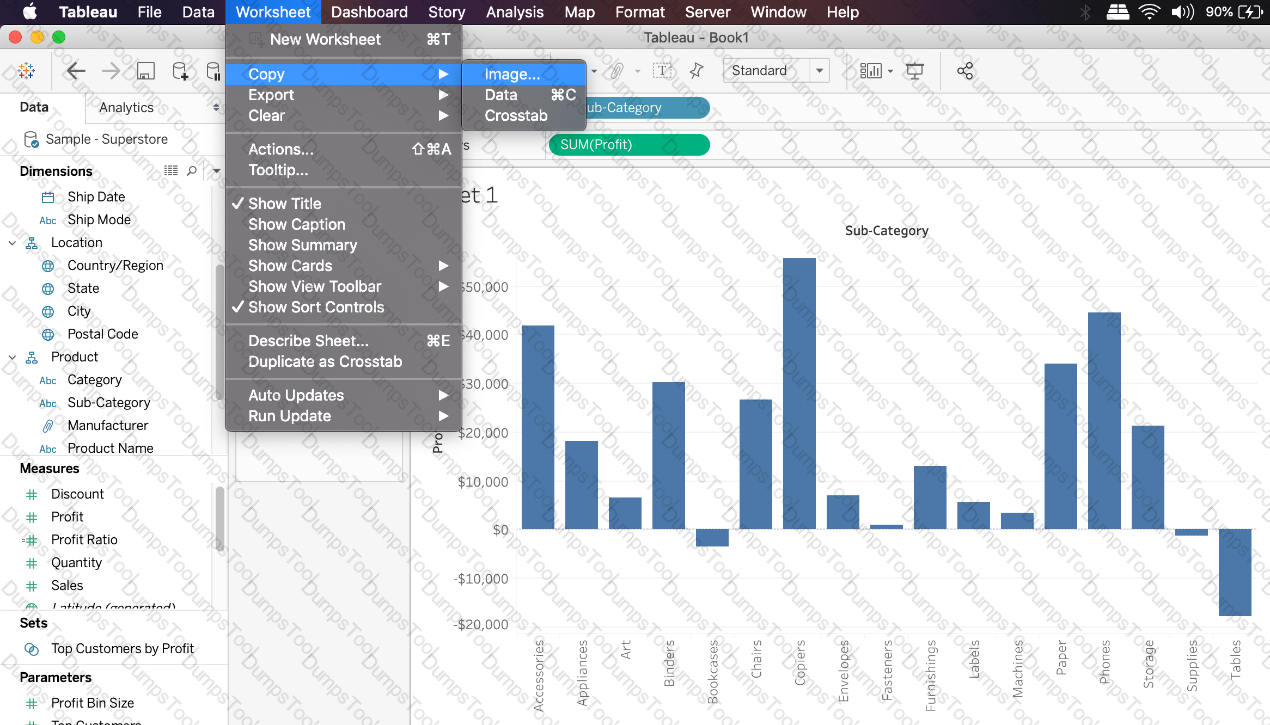
Which of the following are valid ways to copy a worksheet visualisation as an image?
Which of the following charts types always includes bars sorted in descending order?
________________ files are shortcuts for quickly connecting to the original data that you use often. Data source files do not contain the actual data but rather the information necessary to connect to the actual data as well as any modifications you've made on top of the actual data such as changing default properties, creating calculated fields, adding groups, and so on.
Which of the following are the options to export the data used to build the view / visualisations?
True or False: It is possible to change the Geographic Role of a dimension
You have a continuous numeric measure named Sales.
Which chart type is created when you double-click the Sales measure?
Question 30: Skipped
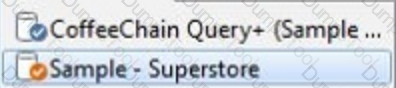
Using the CoffeeChain table, create a scatter plot of Profit (x-axis) vs Sales (y-axis) broken down by State. Add a Linear trend line to the view. What is its R-squared value?
DOWNLOAD THE DATASET FROM: https://drive.google.com/drive/folders/1WXzqsrNmXVdmQ-574wld4InEplyKT8RP?usp=sharing (if you haven't already)
Using the cwurData table, plot a Map to see which country had the Second highest number of patents in the Year 2013?
You have a visualization that uses multiple types of sorting.
How can you clear all sorting of the visualization?
A field that shows average home values for the United States in 2016 is most likely :
Which of the following situations describe the best reason to use a union?
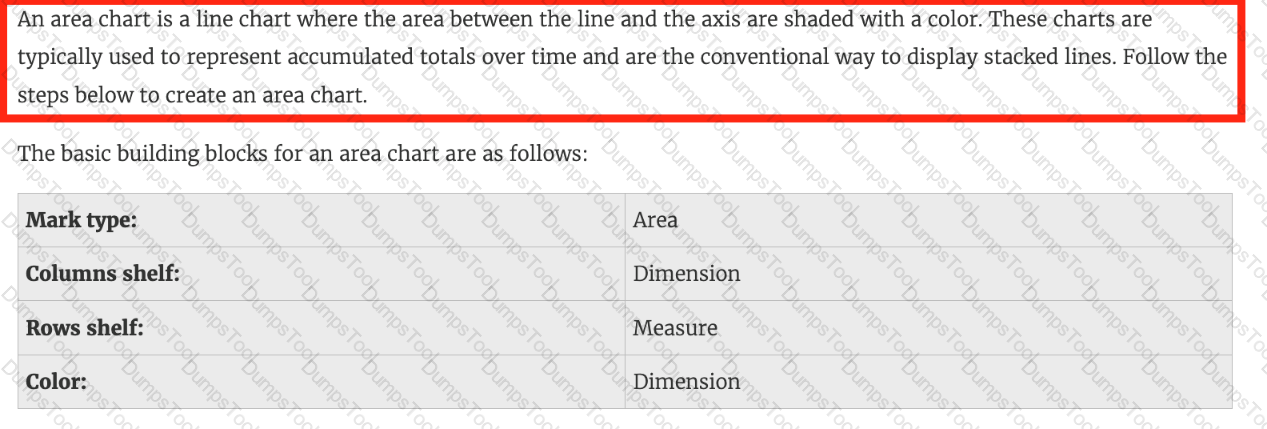
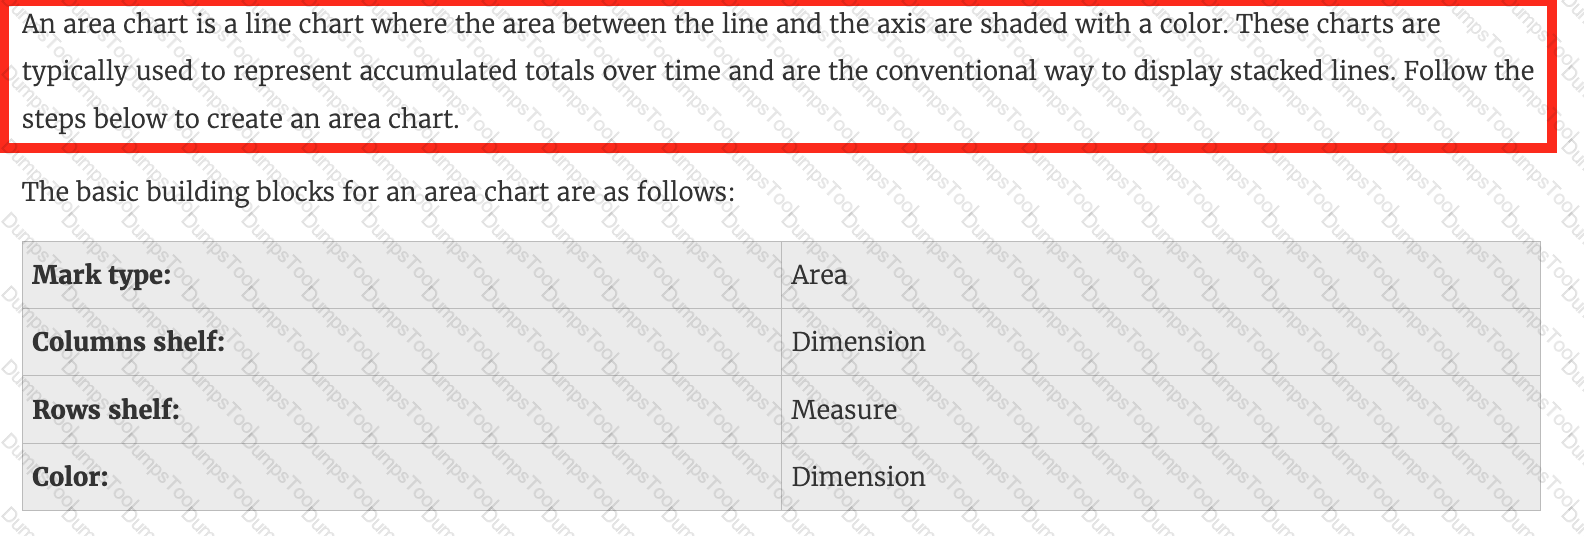
_____________ charts are typically used to represent accumulated totals over time and are the conventional way to display stacked lines.
Which two elements can have their values changed by using a dashboard action? Choose two.
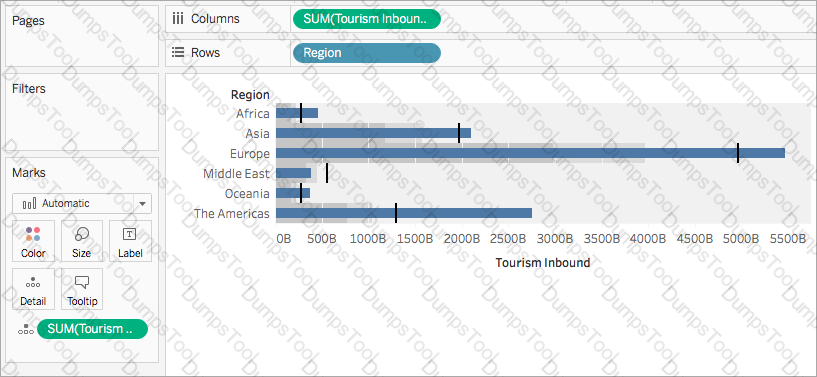
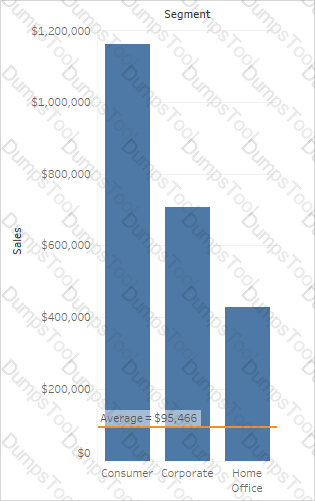
You have the following visualization.
Where should you place a field named Region to show multiple distinct lines on the same axis?
You create a visualization by first adding a measure to rows. Next, you add a dimension wilh 11 members to columns.
Assuming that all the dimensions have a non-zero value, how many marks are in the view before and after the dimension is added?
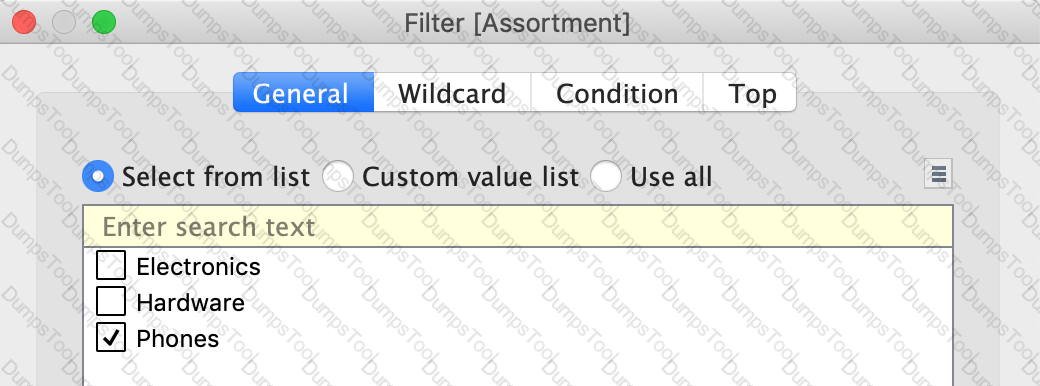
Using the Time-series table, create a cross tab showing the Sales for each Item Number-ID, broken down by Assortments, then add Grand totals to the view. Which Item Number ID made the maximum sales across all assortments?
When working with Excel, text file data, JSON file, .pdf file data, you can use _________________ to union files across folders, and worksheets across workbooks. Search is scoped to the selected connection.
You create a crosstab that shows a list of 100 hotel chains alongside their average nightly cost. You also create two groups showing, respectively, the top 10 and bottom 10 hotel chains by cost, with subtotals.
What should you do to improve the crosstab and compare the two groups to all the remaining hotel chains?
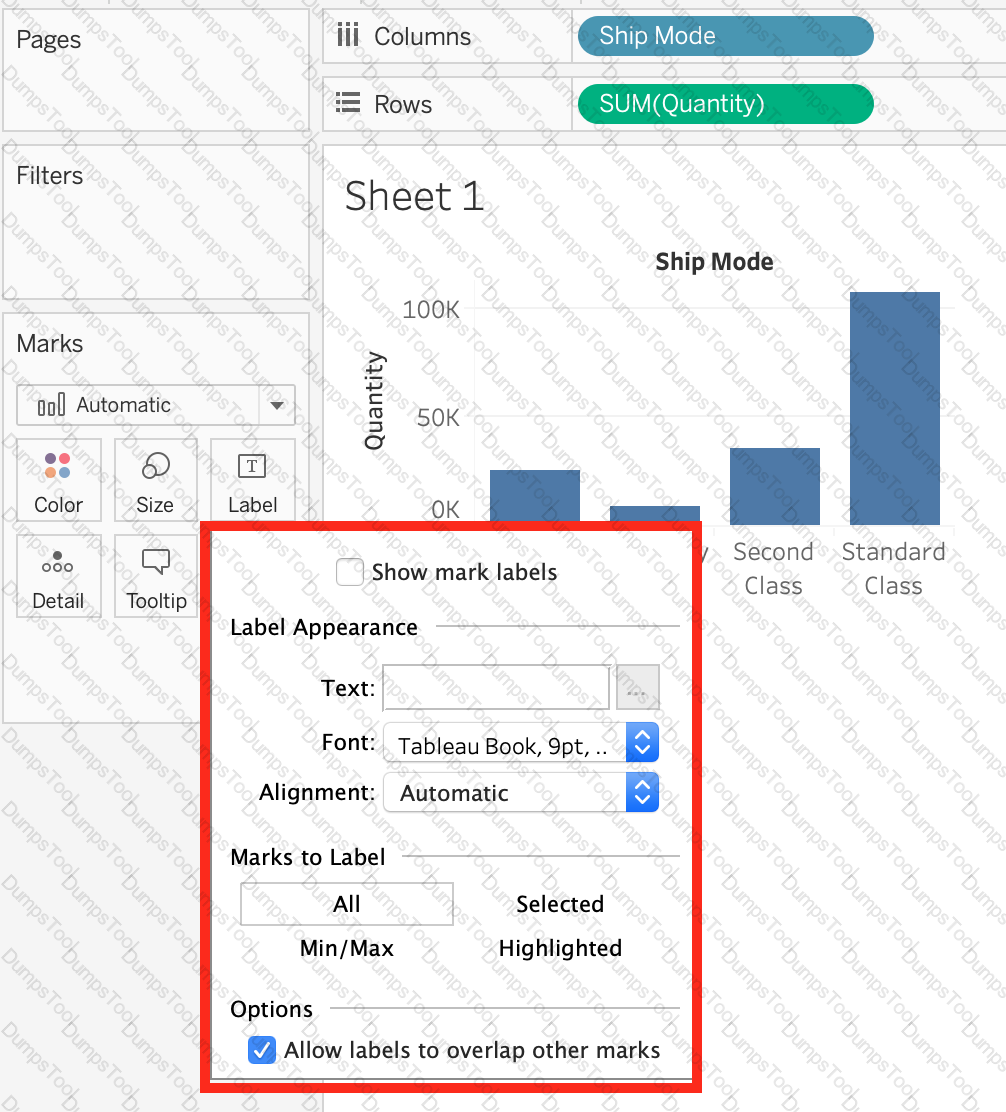
You want to provide additional information when hovering over a field in the Data pane as shown in the following exhibit.
What should you configure for the field?
__________ is a technique in Tableau which will identify marks with similar characteristics
What is the one most important thing you should do after creating a Dual-axis chart?
You need to create a calculation that returns a customer name followed by a comma, a space, and then the customer's age (for example: John Doe, 32).
What should you include in the calculation?
You view the relationship canvas shown in the following exhibit.
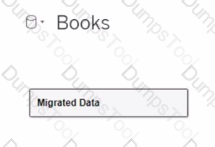
What does Migrated Data indicate?
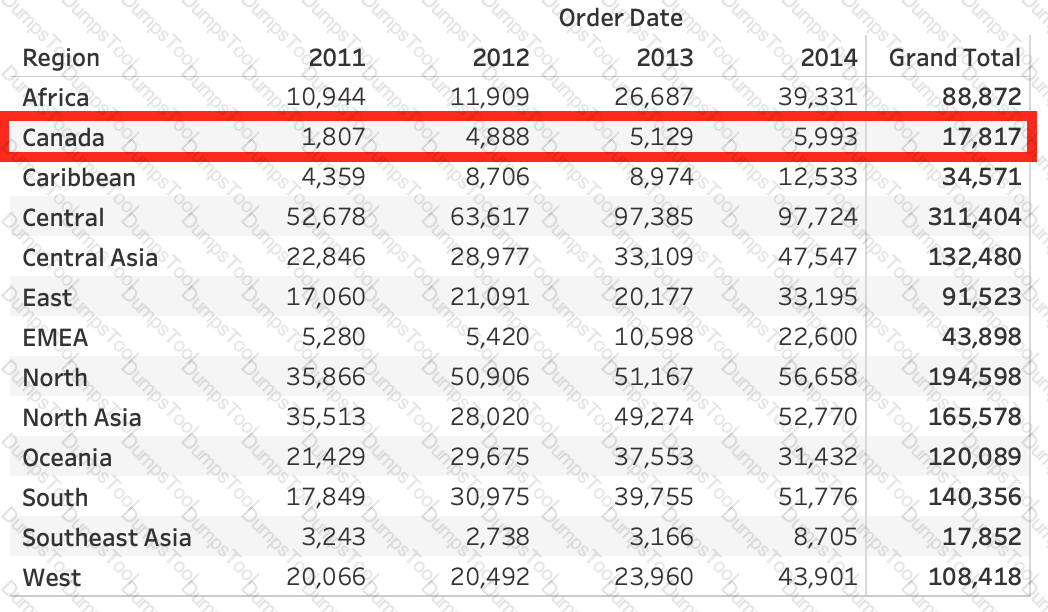
Using the dataset provided, create a crosstab showing the Profit of each Region per Year, then add grand totals to the view. What was the total Profit for Canada in 2012 and the total Profit for Canada for 2011 through 2014, respectively?
What is the default behavior of Tableau when you add a measure to the view?
Which three elements are included in a packaged workbook (.twbx)? Choose three.
Which chart type uses automatically generated sizes that cannot be resized by using the Marks card?
You have a workbook that contains one data source and you need to combine data from another database. What should you do first?
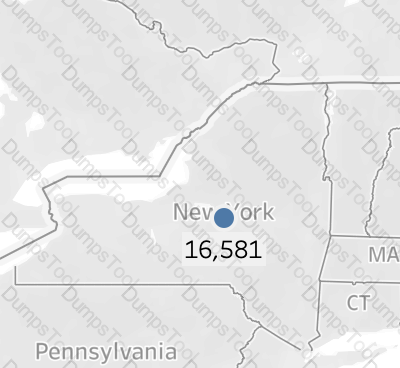
Using the Geo Data Table, create a Map showing Sales made per State. For the State of New York (NY), what was the amount in Sales ($) made for Phone Assortments with White color?
In Tree maps, the size begins with the largest rectangle on the ________________ and the smallest rectangle on the ________________.
Skipped Join the Geo Data and Time Series Table on the Item Number ID column, and display the Store count for every State on a Map. What was the Store count in 2017 for Texas (TX)?
Join the Geo Data and Time Series Table on the Item Number ID column, and display the Store count for every State on a Map. What was the Store count in 2017 for Texas (TX)?
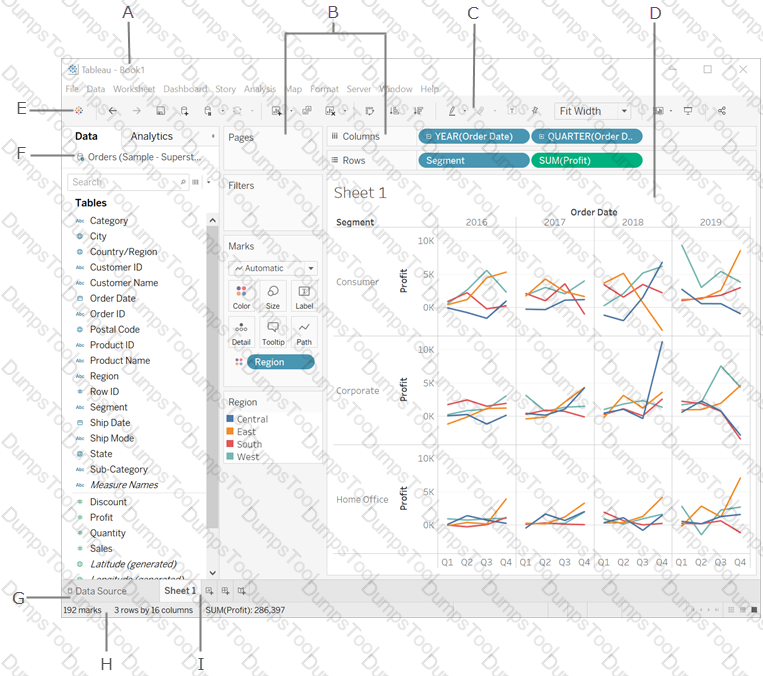
You clicked Sheet 1 from the data source page, and now you have opened the Tableau Desktop workspace as shown above. What is the main thing that you do here?
You have a bar chart that has a dimension on the Columns shelf and a measure on the Rows shelf.
How can you make a stacked bar chart?
Which of the following are valid ways to make the font more readable in Tableau?
True or False: When relating tables, the fields that define the relationships must have the same data type.
Is it possible to use measures in the same view multiple times (e.g. SUM of the measure and AVG of the measure)?
Which of the following are valid ways to export a dashboard with multiple visualisations as an image?
Which two analytics options are available for a scatter plot view? Choose two.
Suppose you create a bar chart by dragging a dimension to the Column shelf and a measure to the Rows shelf. Which of the following would create a stacked bar chart?
Which of the following are valid way(s) to make either of Rows or Columns Bold without affecting the other?
What are two use cases for creating hierarchies from the Data pane? Choose two.
Which chart type uses automatically generated sizes that cannot be resized by using the Marks card?
Which statement accurately describes an extract when the Physical Tables option is selected?
_____________ is a snapshot of the data that Tableau stores locally. Good for very large datasets of which we only need few fields.
To display data that has both negative and positive quantitative values, Tableau Desktop will display marks by using__________________as the default.

TESTED 31 Jul 2026
 Graphical user interface, application
Description automatically generated
Graphical user interface, application
Description automatically generated