Refer to the exhibits.
The Malicious File Detect playbook is configured to create an incident when an event handler generates a malicious file detection event.
Why did the Malicious File Detect playbook execution fail?
The Create Incident task was expecting a name or number as input, but received an incorrect data format
The Get Events task did not retrieve any event data.
The Attach_Data_To_lncident incident task wasexpecting an integer, but received an incorrect data format.
The Attach Data To Incident task failed, which stopped the playbook execution.
Understanding the Playbook Configuration:
The "Malicious File Detect" playbook is designed to create an incident when a malicious file detection event is triggered.
The playbook includes tasks such as Attach_Data_To_Incident, Create Incident, and Get Events.
Analyzing the Playbook Execution:
The exhibit shows that the Create Incident task has failed, and the Attach_Data_To_Incident task has also failed.
The Get Events task succeeded, indicating that it was able to retrieve event data.
Reviewing Raw Logs:
The raw logs indicate an error related to parsing input in the incident_operator.py file.
The error traceback suggests that the task was expecting a specific input format (likely a name or number) but received an incorrect data format.
Identifying the Source of the Failure:
The Create Incident task failure is the root cause since it did not proceed correctly due to incorrect input format.
The Attach_Data_To_Incident task subsequently failed because it depends on the successful creation of an incident.
Conclusion:
The primary reason for the playbook execution failure is that the Create Incident task received an incorrect data format, which was not a name or number as expected.
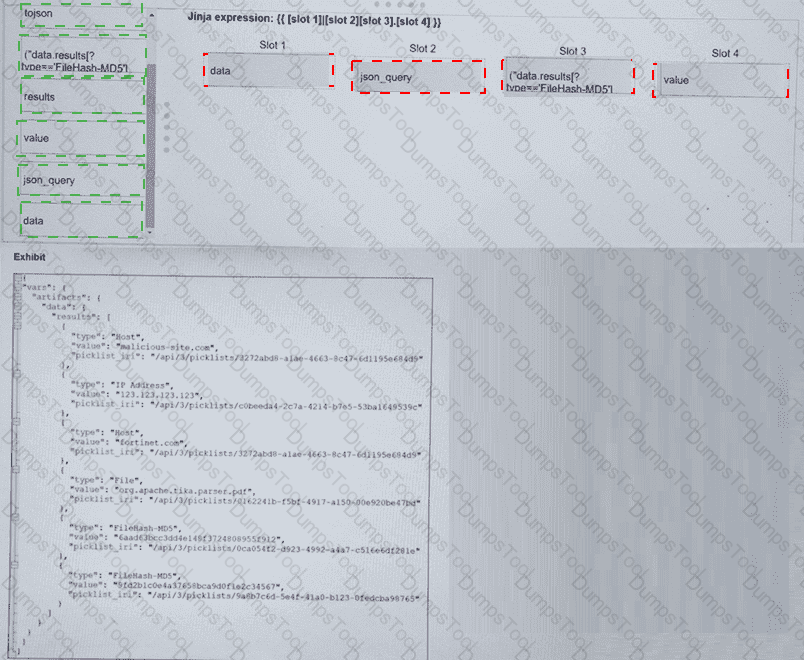
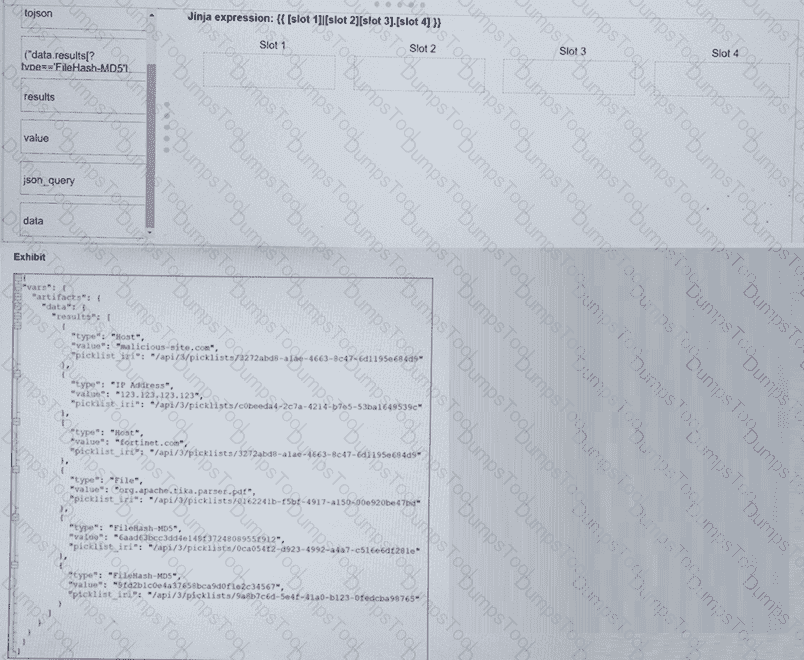
Refer to the exhibit. What is the correct Jinja expression to filter the results to show only the MD5 hash values?
{{ [slot 1] | [slot 2] [slot 3].[slot 4] }}
Select the Jinja expression in the left column, hold and drag it to a blank position on the right. Place the four correct steps in order, placing the first step in the first slot.

Slot 1:dataSlot 2:json_querySlot 3:("results[?type=='FileHash-MD5']")Slot 4:value
Final Expression: {{ vars.artifacts.data | json_query("results[?type=='FileHash-MD5']") .value }}
Comprehensive and Detailed Explanation From FortiSOAR 7.6., FortiSIEM 7.3 Exact Extract study guide:
InFortiSOAR 7.6, advanced data manipulation within playbooks often requires the use ofJMESPathqueries via the json_query Jinja filter. To extract specific data from a complex JSON object (like the vars.artifacts dictionary shown in the exhibit), the analyst must follow the structural hierarchy:
Slot 1 (data):Based on the exhibit, the root of the artifact information is located under vars.artifacts.data. Therefore, "data" is the starting point for the filter.
Slot 2 (json_query):To perform advanced filtering (searching for a specific type), the json_query filter must be applied. This allows the playbook to traverse the list and find items matching a specific key-value pair.
Slot 3 ("results[?type=='FileHash-MD5']"):This is the JMESPath expression. It looks into the results array and applies a filter [?...] to find only those objects where the type attribute exactly matches FileHash-MD5.
Slot 4 (value):Once the correct object(s) are found, the expression needs to return the actual hash. In the JSON exhibit, the MD5 string is stored in the key named value.
Why other options are incorrect:
tojson:This filter converts a dictionary/list into a JSON string, which would break the ability to further query the object for the "value" field.
results (as a standalone slot):While "results" is part of the path, it is handledinsidethe json_query string to allow for conditional filtering.
Refer to the exhibit.
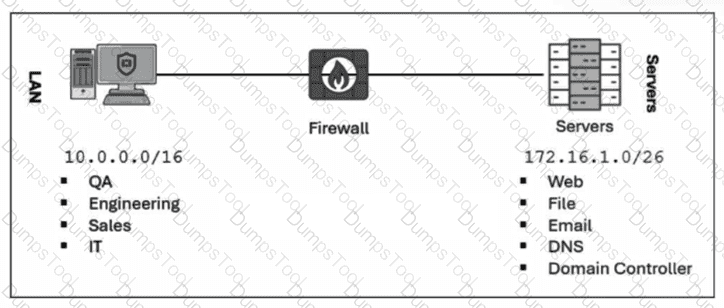
Which method most effectively reduces the attack surface of this organization? (Choose one answer)
Forward all firewall logs to the security information and event management (SIEM) system.
Enable deep inspection on firewall policies.
Implement macrosegmentation.
Remove unused devices.
Comprehensive and Detailed Explanation From FortiSOAR 7.6., FortiSIEM 7.3 Exact Extract study guide:
In the context of theAttack Surface Managementmodules within theFortiSIEM 7.3andFortiSOAR 7.6security frameworks, "reducing the attack surface" refers to the process of minimizing the number of possible entry points (attack vectors) that an unauthorized user could exploit.
Definition of Attack Surface:The attack surface consists of all the different points where an attacker could try to enter data to or extract data from an environment. This includes hardware, software, SaaS components, and network interfaces.
Effectiveness of Asset Removal:Removing unused devices, services, or software is the most fundamental and effective way to reduce the attack surface. By decommissioning an unused server or workstation (as shown in the LAN/Server diagram), you completely eliminate all potential vulnerabilities associated with that asset, its operating system, and its active services.
Contrast with other methods:
Forwarding logs (A)andDeep Inspection (B)aredetectiveandpreventivecontrols, respectively. They help manage the risk within the existing attack surface but do not actually shrink the size of the surface itself.
Macrosegmentation (C)limits the "blast radius" or lateral movement after a compromise has occurred. While it secures the interior, it does not remove the initial entry points that define the external attack surface.
Why other options are incorrect:
Forwarding logs (A):This increases visibility but does not remove potential vulnerabilities.
Deep Inspection (B):This is a security measure to detect threats within existing traffic but does not eliminate the target (the device) itself.
Implement macrosegmentation (C):While highly recommended for security, it is a network architecture strategy to contain threats, whereas the prompt asks for the most effective method toreducethe surface. Removing the asset entirely (D) is the most absolute reduction possible.
Refer to Exhibit:
A SOC analyst is creating the Malicious File Detected playbook to run when FortiAnalyzer generates a malicious file event. The playbook must also update the incident with the malicious file event data.
What must the next task in this playbook be?
A local connector with the action Update Asset and Identity
A local connector with the action Attach Data to Incident
A local connector with the action Run Report
A local connector with the action Update Incident
Understanding the Playbook and its Components:
The exhibit shows a playbook in which an event trigger starts actions upon detecting a malicious file.
The initial tasks in the playbook include CREATE_INCIDENT and GET_EVENTS.
Analysis of Current Tasks:
EVENT_TRIGGER STARTER: This initiates the playbook when a specified event (malicious file detection) occurs.
CREATE_INCIDENT: This task likely creates a new incident in the incident management system for tracking and response.
GET_EVENTS: This task retrieves the event details related to the detected malicious file.
Objective of the Next Task:
The next logical step after creating an incident and retrieving event details is to update the incident with the event data, ensuring all relevant information is attached to the incident record.
This helps SOC analysts by consolidating all pertinent details within the incident record, facilitating efficient tracking and response.
Evaluating the Options:
Option A:Update Asset and Identity is not directly relevant to attaching event data to the incident.
Option B:Attach Data to Incident sounds plausible but typically, updating an incident involves more comprehensive changes including status updates, adding comments, and other data modifications.
Option C:Run Report is irrelevant in this context as the goal is to update the incident with event data.
Option D:Update Incident is the most suitable action for incorporating event data into the existing incident record.
Conclusion:
The next task in the playbook should be to update the incident with the event data to ensure the incident reflects all necessary information for further investigation and response.
Which two ways can you create an incident on FortiAnalyzer? (Choose two.)
Using a connector action
Manually, on the Event Monitor page
By running a playbook
Using a custom event handler
Understanding Incident Creation in FortiAnalyzer:
FortiAnalyzer allows for the creation of incidents to track and manage security events.
Incidents can be created both automatically and manually based on detected events and predefined rules.
Analyzing the Methods:
Option A:Using a connector action typically involves integrating with other systems or services and is not a direct method for creating incidents on FortiAnalyzer.
Option B:Incidents can be created manually on the Event Monitor page by selecting relevant events and creating incidents from those events.
Option C:While playbooks can automate responses and actions, the direct creation of incidents is usually managed through event handlers or manual processes.
Option D:Custom event handlers can be configured to trigger incident creation based on specific events or conditions, automating the process within FortiAnalyzer.
Conclusion:
The two valid methods for creating an incident on FortiAnalyzer are manually on the Event Monitor page and using a custom event handler.
Which of the following are critical when analyzing and managing events and incidents in a SOC? (Choose two answers)
Accurate detection of threats
Immediate escalation for all alerts
Rapid identification of false positives
Periodic system downtime for maintenance
Comprehensive and Detailed Explanation From FortiSOAR 7.6., FortiSIEM 7.3 Exact Extract study guide:
In a modern Security Operations Center (SOC) environment powered byFortiSIEM 7.3andFortiSOAR 7.6, the efficiency of the incident response lifecycle depends on two primary pillars of analysis:
Accurate detection of threats (A):The primary goal of a SOC is to identify genuine malicious activity. Using FortiSIEM's correlation rules and machine learning (UEBA), the system must be tuned to detect patterns that signify real risk. Accuracy ensures that the SOC is not blinded by noise and can focus on critical security events that impact the organization's posture.
Rapid identification of false positives (C):"Alert Fatigue" is one of the greatest challenges in a SOC. Analysts must be able to quickly distinguish between legitimate anomalies (false positives) and actual threats.FortiSOARassists in this by using automated playbooks to perform initial triage and "pre-processing"—such as checking IP reputations or verifying user activity—to automatically close or demote alerts that do not represent a true threat, thereby freeing up analysts for high-priority investigations.
Why other options are incorrect:
Immediate escalation for all alerts (B):This is a poor SOC practice. Escalating every alert without triage leads to analyst burnout and overloads senior responders with low-value tasks. The goal of a tiered SOC (Tier 1, Tier 2, Tier 3) is to filter alerts so only significant incidents are escalated.
Periodic system downtime (D):SOC systems (SIEM/SOAR) are considered "Mission Critical" and must operate on a24/7/365basis. Maintenance should be performed using High Availability (HA) configurations or during "low-flow" windows without causing a complete stop in monitoring, as attackers often leverage downtime to strike.
Review the incident report:
Packet captures show a host maintaining periodic TLS sessions that imitate normal HTTPS traffic but run on TCP 8443 to a single external host. An analyst flags the traffic as potential command-and-control. During the same period, the host issues frequent DNS queries with oversized TXT payloads to an attacker-controlled domain, transferring staged files.
Which two MITRE ATT&CK techniques best describe this activity? (Choose two answers)
Non-Standard Port
Exploitation of Remote Services
Exfiltration Over Alternative Protocol
Hide Artifacts
Comprehensive and Detailed Explanation From FortiSOAR 7.6., FortiSIEM 7.3 Exact Extract study guide:
In accordance with the MITRE ATT&CK mapping utilized byFortiSIEM 7.3andFortiSOAR 7.6, the described behaviors correspond to the following techniques:
Non-Standard Port (T1571):This technique involves adversaries communicating using a protocol and port pairing that are typically not associated. The incident report identifies HTTPS (TLS) traffic running onTCP 8443rather than the standard port 443.FortiSIEMspecifically includes built-in correlation rules, such as "Suspicious Typical Malware Back Connect Ports," designed to detect these protocol-port mismatches.
Exfiltration Over Alternative Protocol (T1048):This technique describes adversaries stealing data by exfiltrating it over a different protocol than the primary command and control (C2) channel. In this scenario, while the C2 channel is established via HTTPS on port 8443, the adversary is transferring staged files usingDNS queries with oversized TXT payloads. DNS is a common "alternative protocol" used to bypass standard data transfer monitoring and egress filtering.
Analysis of Incorrect Options:
Exploitation of Remote Services (B):This technique falls underInitial AccessorLateral Movementtactics, focusing on gaining entry into a system via vulnerabilities in network services like SMB or RDP. It does not apply to the maintenance of an established C2 channel or the exfiltration of data.
Hide Artifacts (D):This is aDefense Evasiontechnique where an adversary attempts to conceal their presence by removing traces such as log files or registry keys. While the attacker is "imitating normal traffic," the specific acts of using a non-standard port and DNS exfiltration are primary behavioral signatures defined by their own more specific techniques.
Exhibit:
Which observation about this FortiAnalyzer Fabric deployment architecture is true?
The AMER HQ SOC team cannot run automation playbooks from the Fabric supervisor.
The AMER HQ SOC team must configure high availability (HA) for the supervisor node.
The EMEA SOC team has access to historical logs only.
The APAC SOC team has access to FortiView and other reporting functions.
Understanding FortiAnalyzer Fabric Deployment:
FortiAnalyzer Fabric deployment involves a hierarchical structure where the Fabric root (supervisor) coordinates with multiple Fabric members (collectors and analyzers).
This setup ensures centralized log collection, analysis, and incident response across geographically distributed locations.
Analyzing the Exhibit:
FAZ1-Supervisoris located at AMER HQ and acts as the Fabric root.
FAZ2-Analyzeris a Fabric member located in EMEA.
FAZ3-CollectorandFAZ4-Collectorare Fabric members located in EMEA and APAC, respectively.
Evaluating the Options:
Option A:The statement indicates that the AMER HQ SOC team cannot run automation playbooks from the Fabric supervisor. This is true because automation playbooks and certain orchestration tasks typically require local execution capabilities which may not be fully supported on the supervisor node.
Option B:High availability (HA) configuration for the supervisor node is a best practice for redundancy but is not directly inferred from the given architecture.
Option C:The EMEA SOC team having access to historical logs only is not correct since FAZ2-Analyzer provides full analysis capabilities.
Option D:The APAC SOC team has access to FortiView and other reporting functions through FAZ4-Collector, but this is not explicitly detailed in the provided architecture.
Conclusion:
The most accurate observation about this FortiAnalyzer Fabric deployment architecture is that the AMER HQ SOC team cannot run automation playbooks from the Fabric supervisor.
Which three end user logs does FortiAnalyzer use to identify possible IOC compromised hosts? (Choose three.)
Email filter logs
DNS filter logs
Application filter logs
IPS logs
Web filter logs
Overview of Indicators of Compromise (IoCs): Indicators of Compromise (IoCs) are pieces of evidence that suggest a system may have been compromised. These can include unusual network traffic patterns, the presence of known malicious files, or other suspicious activities.
FortiAnalyzer's Role: FortiAnalyzer aggregates logs from various Fortinet devices to provide comprehensive visibility and analysis of network events. It uses these logs to identify potential IoCs and compromised hosts.
Relevant Log Types:
DNS Filter Logs:
DNS requests are a common vector for malware communication. Analyzing DNS filter logs helps in identifying suspicious domain queries, which can indicate malware attempting to communicate with command and control (C2) servers.
Which statement best describes the MITRE ATT&CK framework?
It provides a high-level description of common adversary activities, but lacks technical details
It covers tactics, techniques, and procedures, but does not provide information about mitigations.
It describes attack vectors targeting network devices and servers, but not user endpoints.
It contains some techniques or subtechniques that fall under more than one tactic.
Understanding the MITRE ATT&CK Framework:
The MITRE ATT&CK framework is a comprehensive matrix of tactics and techniques used by adversaries to achieve their objectives.
It is widely used for understanding adversary behavior, improving defense strategies, and conducting security assessments.
Analyzing the Options:
Option A:The framework provides detailed technical descriptions of adversary activities, including specific techniques and subtechniques.
Option B:The framework includes information about mitigations and detections for each technique and subtechnique, providing comprehensive guidance.
Option C:MITRE ATT&CK covers a wide range of attack vectors, including those targeting user endpoints, network devices, and servers.
Option D:Some techniques or subtechniques do indeed fall under multiple tactics, reflecting the complex nature of adversary activities that can serve different objectives.
Conclusion:
The statement that best describes the MITRE ATT&CK framework is that it contains some techniques or subtechniques that fall under more than one tactic.
What are three capabilities of the built-in FortiSOAR Jinja editor? (Choose three answers)
It renders output by combining Jinja expressions and JSON input.
It checks the validity of a Jinja expression.
It creates new records in bulk.
It loads the environment JSON of a recently executed playbook.
It defines conditions to trigger a playbook step.
Comprehensive and Detailed Explanation From FortiSOAR 7.6., FortiSIEM 7.3 Exact Extract study guide:
The built-in Jinja editor inFortiSOAR 7.6is a powerful utility designed to help playbook developers write and test complex data manipulation logic without having to execute the entire playbook. Its primary capabilities include:
Renders output (A):The editor provides a "Preview" or "Evaluation" pane. By combining aJinja expressionwith a sampleJSON input(manually entered or loaded), the editor dynamically calculates and displays the resulting output. This allows for immediate verification of data transformation logic.
Checks validity (B):The editor includes built-in linting and syntax validation. It alerts the developer to errors such as unclosed brackets, incorrect filter usage, or invalid syntax, ensuring that only valid Jinja code is saved into the playbook step.
Loads environment JSON (D):One of the most significant features for troubleshooting is the ability toload the environment JSONfrom a recent execution. This populates the editor's variable context (vars) with the actual data from a specific playbook run, allowing the developer to test expressions against real-world data that recently passed through the system.
Why other options are incorrect:
Creates new records in bulk (C):While Jinja expressions are used to format the data that goes into a record, the actual creation of records is handled by the"Create Record"step or specificConnectors, not by the Jinja editor utility itself.
Defines conditions to trigger a playbook step (E):Jinja is thelanguageused to write conditions within a "Decision" step or "Step Utilities," but the Jinja Editor is a tool forevaluating and testingthose expressions. The definition of the condition logic and the triggering behavior is a function of the Playbook Engine and Step configuration, not the editor's standalone capabilities.
Refer to the exhibit.
Assume that all devices in the FortiAnalyzer Fabric are shown in the image.
Which two statements about the FortiAnalyzer Fabric deployment are true? (Choose two.)
FortiGate-B1 and FortiGate-B2 are in a Security Fabric.
There is no collector in the topology.
All FortiGate devices are directly registered to the supervisor.
FAZ-SiteA has two ADOMs enabled.
Understanding the FortiAnalyzer Fabric:
The FortiAnalyzer Fabric provides centralized log collection, analysis, and reporting for connected FortiGate devices.
Devices in a FortiAnalyzer Fabric can be organized into different Administrative Domains (ADOMs) to separate logs and management.
Analyzing the Exhibit:
FAZ-SiteAandFAZ-SiteBare FortiAnalyzer devices in the fabric.
FortiGate-B1andFortiGate-B2are shown under theSite-B-Fabric, indicating they are part of the same Security Fabric.
FAZ-SiteAhas multiple entries under it:SiteAandMSSP-Local, suggesting multiple ADOMs are enabled.
Evaluating the Options:
Option A:FortiGate-B1 and FortiGate-B2 are underSite-B-Fabric, indicating they are indeed part of the same Security Fabric.
Option B:The presence of FAZ-SiteA and FAZ-SiteB as FortiAnalyzers does not preclude the existence of collectors. However, there is no explicit mention of a separate collector role in the exhibit.
Option C:Not all FortiGate devices are directly registered to the supervisor. The exhibit shows hierarchical organization under different sites and ADOMs.
Option D:The multiple entries underFAZ-SiteA(SiteA and MSSP-Local) indicate that FAZ-SiteA has two ADOMs enabled.
Conclusion:
FortiGate-B1 and FortiGate-B2 are in a Security Fabric.
FAZ-SiteA has two ADOMs enabled.
TESTED 04 Jan 2026
Copyright © 2014-2026 DumpsTool. All Rights Reserved