Why must you wait for several minutes before you run a playbook that you just created?
FortiAnalyzer needs that time to parse the new playbook.
FortiAnalyzer needs that time to debug the new playbook.
FortiAnalyzer needs that time to back up the current playbooks.
FortiAnalyzer needs that time to ensure there are no other playbooks running.
When a new playbook is created on FortiAnalyzer, the system requires some time to parse and validate the playbook before it can be executed. Parsing involves checking the playbook's structure, ensuring that all syntax and logic are correct, and preparing the playbook for execution within FortiAnalyzer’s automation engine. This initial parsing step is necessary for FortiAnalyzer to load the playbook into its operational environment correctly.
Here’s why the other options are incorrect:
Option A: FortiAnalyzer needs that time to parse the new playbook
This is correct. The delay is due to the parsing and setup process required to prepare the new playbook for execution. FortiAnalyzer’s automation engine checks for any issues or dependencies within the playbook, ensuring that it can run without errors.
Option B: FortiAnalyzer needs that time to debug the new playbook
This is incorrect. Debugging is not an automatic process that FortiAnalyzer undertakes after playbook creation. Debugging, if necessary, is a manual task performed by the administrator if there are issues with the playbook execution.
Option C: FortiAnalyzer needs that time to back up the current playbooks
This is incorrect. FortiAnalyzer does not automatically back up playbooks every time a new one is created. Backups of configuration and playbooks are typically scheduled as part of routine maintenance and are not triggered by playbook creation.
Option D: FortiAnalyzer needs that time to ensure there are no other playbooks running
This is incorrect. FortiAnalyzer can manage multiple playbooks running simultaneously, so it does not require waiting for other playbooks to finish before initiating a new one. The waiting time specifically relates to the parsing process of the newly created playbook.
Which statement about the FortiSOAR management extension is correct?
It requires a FortiManager configured to manage FortiGate.
It runs as a docker container on FortiAnalyzer.
It requires a dedicated FortiSOAR device or VM.
It does not include a limited trial by default.
The FortiSOAR management extension is designed as an independent security orchestration, automation, and response (SOAR) solution that integrates with other Fortinet products but requires its own dedicated device or virtual machine (VM) environment. FortiSOAR is not natively integrated as a container or service within FortiAnalyzer or FortiManager, and it operates separately to manage complex security workflows and incident responses across various platforms.
Let’s examine each option to determine the correct answer:
Option A: It requires a FortiManager configured to manage FortiGate
This is incorrect. FortiSOAR operates independently of FortiManager. While FortiSOAR can receive input or data from FortiGate (often managed by FortiManager), it does not require FortiManager to be part of its setup.
Option B: It runs as a docker container on FortiAnalyzer
This is incorrect. FortiSOAR does not run as a container within FortiAnalyzer. It requires its own dedicated environment, either as a physical device or a virtual machine, due to the resource requirements and specialized functions it performs.
Option C: It requires a dedicated FortiSOAR device or VM
This is correct. FortiSOAR is deployed as a standalone device or VM, which enables it to handle the intensive processing needed for orchestrating security operations, integrating with third-party tools, and automating responses across an organization’s security infrastructure.
Option D: It does not include a limited trial by default
This is incorrect. FortiSOAR installations may come with trial options or demos in specific scenarios, especially for evaluation purposes. This depends on licensing and deployment policies.
Exhibit.
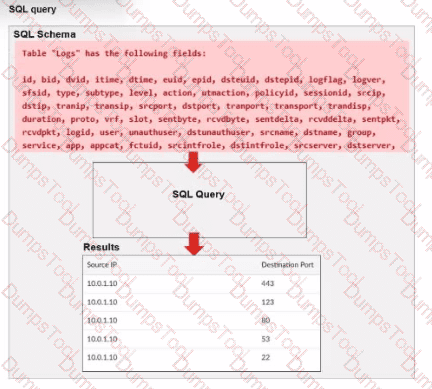
A fortiAnalyzer analyst is customizing a SQL query to use in a report.
Which SQL query should the analyst run to get the expected results?
A)

B)

C)

D)

Option A
Option B
Option C
Option D
The requirement here is to construct a SQL query that retrieves logs with specific fields, namely "Source IP" and "Destination Port," for entries where the source IP address matches 10.0.1.10. The correct syntax is essential for selecting, filtering, ordering, and grouping the results as shown in the expected outcome.
Analysis of the Options:
Option A Explanation:
SELECT srcip AS "Source IP", dstport AS "Destination Port": This syntax selects srcip and dstport, renaming them to "Source IP" and "Destination Port" respectively in the output.
FROM $log: Specifies the log table as the data source.
WHERE $filter AND srcip = '10.0.1.10': This line filters logs to only include entries with srcip equal to 10.0.1.10.
ORDER BY dstport DESC: Orders the results in descending order by dstport.
GROUP BY srcip, dstport: Groups results by srcip and dstport, which is valid SQL syntax.
This option meets all the requirements to get the expected results accurately.
Option B Explanation:
WHERE $filter AND Source IP != '10.0.1.10': Uses != instead of =. This would exclude logs from the specified IP 10.0.1.10, which is contrary to the expected result.
Option C Explanation:
The ORDER BY clause appears before the FROM clause, which is incorrect syntax. SQL requires the FROM clause to follow the SELECT clause directly.
Option D Explanation:
The GROUP BY clause should follow the FROM clause. However, here, it’s located after WHERE, making it syntactically incorrect.
Conclusion:
Correct Answer: A. Option A
This option aligns perfectly with standard SQL syntax and filters correctly for srcip = '10.0.1.10', while ordering and grouping as required.
You created a playbook on FortiAnalyzer that uses a FortiOS connector.
When configuring the FortiGate side, which type of trigger must be used so that the actions in an automation stich are available in the FortiOS connector?
FortiAnalyzer Event Handler
Fabric Connector event
FortiOS Event Log
Incoming webhook
When using FortiAnalyzer to create playbooks that interact with FortiOS devices, an Incoming Webhook trigger is required on the FortiGate side to make the actions in an automation stitch accessible through the FortiOS connector. The incoming webhook trigger allows FortiAnalyzer to initiate actions on FortiGate by sending HTTP POST requests to specified endpoints, which in turn trigger automation stitches defined on the FortiGate.
Here’s an analysis of each option:
Option A: FortiAnalyzer Event Handler
This is incorrect. The FortiAnalyzer Event Handler is used within FortiAnalyzer itself for handling log events and alerts, but it does not trigger automation stitches on FortiGate.
Option B: Fabric Connector event
This is incorrect. Fabric Connector events are related to Fortinet's Security Fabric integrations but are not specifically used to trigger FortiGate automation stitches from FortiAnalyzer.
Option C: FortiOS Event Log
This is incorrect. While FortiOS event logs can be used for monitoring, they are not designed to trigger automation stitches directly from FortiAnalyzer.
Option D: Incoming webhook
This is correct. The Incoming Webhook trigger on FortiGate enables it to receive requests from FortiAnalyzer, allowing playbooks to activate automation stitches defined on the FortiGate device. This method is commonly used to integrate actions from FortiAnalyzer to FortiGate via the FortiOS connector.
Refer to Exhibit:
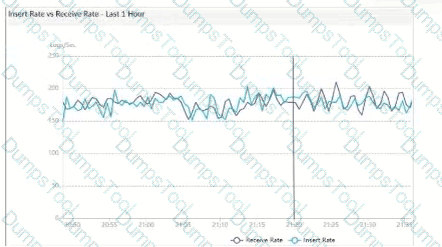
What does the data point at 21:20 indicate?
FortiAnalyzer is indexing logs faster than logs are being received.
The fortilogd daemon is ahead in indexing by one log.
The SQL database requires a rebuild because of high receive lag.
FortiAnalyzer is temporarily buffering received logs so older logs can be indexed first.
The exhibit shows a graph that tracks two metrics over time: Receive Rate and Insert Rate. These two rates are crucial for understanding the log processing behavior in FortiAnalyzer.
Understanding Receive Rate and Insert Rate:
Receive Rate: This is the rate at which FortiAnalyzer is receiving logs from connected devices.
Insert Rate: This is the rate at which FortiAnalyzer is indexing (inserting) logs into its database for storage and analysis.
Data Point at 21:20:
At 21:20, the Insert Rate line is above the Receive Rate line, indicating that FortiAnalyzer is inserting logs into its database at a faster rate than it is receiving them. This situation suggests that FortiAnalyzer is able to keep up with the incoming logs and is possibly processing a backlog or temporarily received logs faster than new logs are coming in.
Option Analysis:
Option A - FortiAnalyzer is Indexing Logs Faster Than Logs are Being Received: This accurately describes the scenario at 21:20, where the Insert Rate exceeds the Receive Rate. This indicates that FortiAnalyzer is handling logs efficiently at that moment, with no backlog in processing.
Option B - The fortilogd Daemon is Ahead in Indexing by One Log: The data does not provide specific information about the fortilogd daemon’s log count, only the rates. This option is incorrect.
Option C - SQL Database Requires a Rebuild: High receive lag would imply a backlog in receiving and indexing logs, typically visible if the Receive Rate were significantly above the Insert Rate, which is not the case here.
Option D - FortiAnalyzer is Temporarily Buffering Logs to Index Older Logs First: There is no indication of buffering in this scenario. Buffering would usually occur if the Receive Rate were higher than the Insert Rate, indicating that FortiAnalyzer is storing logs temporarily due to indexing lag.
Conclusion:
Correct Answer: A. FortiAnalyzer is indexing logs faster than logs are being received.
The graph at 21:20 shows a higher Insert Rate than Receive Rate, indicating efficient log processing by FortiAnalyzer.
Which statement about sending notifications with incident update is true?
You can send notifications to multiple external platforms.
Notifications can be sent only by email.
If you use multiple fabric connectors, all connectors must have the same settings.
Notifications can be sent only when an incident is updated or deleted.
In FortiOS and FortiAnalyzer, incident notifications can be sent to multiple external platforms, not limited to a single method such as email. Fortinet's security fabric and integration capabilities allow notifications to be sent through various fabric connectors and third-party integrations. This flexibility is designed to ensure that incident updates reach relevant personnel or systems using preferred communication channels, such as email, Syslog, SNMP, or integration with SIEM platforms.
Let’s review each answer option for clarity:
Option A: You can send notifications to multiple external platforms
This is correct. Fortinet’s notification system is capable of sending updates to multiple platforms, thanks to its support for fabric connectors and external integrations. This includes options such as email, Syslog, SNMP, and others based on configured connectors.
Option B: Notifications can be sent only by email
This is incorrect. Although email is a common method, FortiOS and FortiAnalyzer support multiple notification methods through various connectors, allowing notifications to be directed to different platforms as per the organization’s setup.
Option C: If you use multiple fabric connectors, all connectors must have the same settings
This is incorrect. Each fabric connector can have its unique configuration, allowing different connectors to be tailored for specific notification and integration requirements.
Option D: Notifications can be sent only when an incident is updated or deleted
This is incorrect. Notifications can be sent upon the creation of incidents, as well as upon updates or deletion, depending on the configuration.
Exhibit.
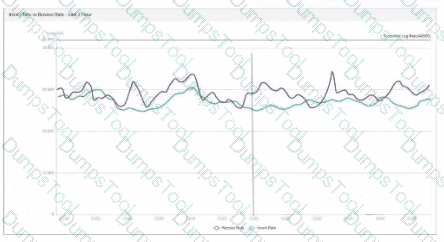
What does the data point at 12:20 indicate?
The log insert log time is increasing.
FortiAnalyzer is using its cache to avoid dropping logs.
The performance of FortiAnalyzer is below the baseline.
The sqiplugind service is caught up with the logs
Which log will generate an event with the status Contained?
An AV log with action=quarantine.
An IPS log with action=pass.
A WebFilter log will action=dropped.
An AppControl log with action=blocked.
Exhibit.
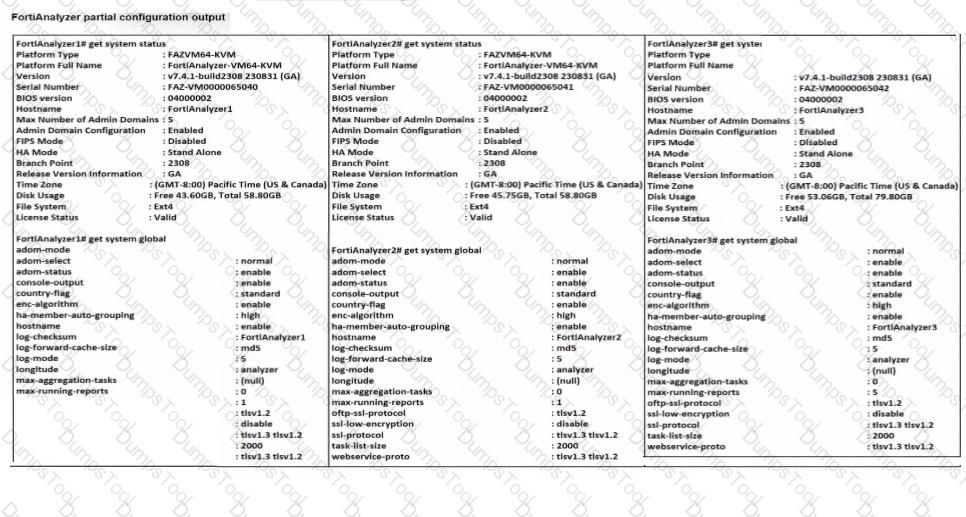
Based on the partial outputs displayed, which devices can be members of a FotiAnalyzer Fabric?
FortiAnalayzer1 and FortiAnalyzer3
FortiAnalyzer1 and FortiAnalyzer2
FortiAnalyzer2 and FortiAnalyzer3
All devices listed can be members.
In a FortiAnalyzer Fabric, devices can participate in a cluster or grouping if they meet specific compatibility criteria. Based on the outputs provided, let’s evaluate these criteria:
Version Compatibility:
All three devices, FortiAnalyzer1, FortiAnalyzer2, and FortiAnalyzer3, are running version v7.4.1-build0238, which is the same across the board. This version alignment is crucial because FortiAnalyzer Fabric requires that devices run compatible firmware versions for seamless communication and management.
Platform Type and Configuration:
All three devices are configured as Standalone in the HA mode, which allows them to operate independently but does not restrict their participation in a FortiAnalyzer Fabric. Each device is also on the FAZVM64-KVM platform type, ensuring hardware compatibility.
Global Settings:
Key settings such as adm-mode, adm-status, and adom-mode are consistent across all devices (adm-mode: normal, adm-status: enable, adom-mode: normal), which aligns with requirements for fabric integration and role assignment flexibility.
Each device also has the log-forward-cache-size set, which is relevant for forwarding logs within a fabric environment.
Based on the above analysis, all devices (FortiAnalyzer1, FortiAnalyzer2, and FortiAnalyzer3) meet the requirements to be part of a FortiAnalyzer Fabric.
Exhibit.
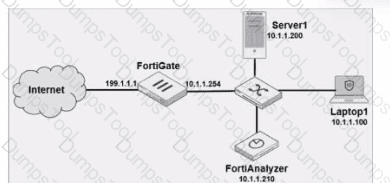
Laptop1 is used by several administrators to manage FotiAnalyzer. You want to configure a generic text filter that matches all login attempts to the web interface generated by any user other than admin’’, and coming from Laptop1.
Which filter will achieve the desired result?
Operation-login and performed_on==’’GUI(10.1.1.100)’ and user!=admin
Operation-login and performed_on==’’GU (10.1.1.120)’ and user!=admin
Operation-login and srcip== 10.1.1.100 and dstip==10.1.1.1.210 and user==admin
Operation-login and dstip==10.1.1.210 and user!-admin
The objective is to create a filter that identifies all login attempts to the FortiAnalyzer web interface (GUI) coming from Laptop1 (IP 10.1.1.100) and excludes the admin user. This filter should match any user other than admin.
Filter Components Analysis:
Operation-login: This portion of the filter will target login actions specifically, which is correct for filtering login attempts.
performed_on==’’GUI(10.1.1.100)’: This indicates that the login attempt must occur on the GUI interface and originate from the specified IP, which matches Laptop1's IP address (10.1.1.100). This ensures that the filter only matches GUI logins from this specific device.
user!=admin: This part excludes logins by the admin user, meeting the requirement to capture only non-admin users.
Option Analysis:
Option A: Correctly specifies the Operation-login, performed_on==’’GUI(10.1.1.100)’, and user!=admin. This setup effectively filters login attempts to the GUI from Laptop1, excluding the admin user.
Option B: Uses the incorrect IP 10.1.1.120 in the performed_on filter, which does not match Laptop1's IP (10.1.1.100).
Option C: This option includes srcip==10.1.1.100 and dstip==10.1.1.210 but incorrectly specifies user==admin instead of user!=admin, which does not match the requirement to exclude admin users.
Option D: This option does not specify the performed_on field to restrict it to the GUI and only includes dstip (destination IP) without srcip. It also incorrectly uses user!-admin instead of the correct syntax user!=admin.
Conclusion:
Correct Answer: A. Operation-login and performed_on==’’GUI(10.1.1.100)’ and user!=admin
This filter precisely captures the required conditions: login attempts from Laptop1 to the GUI interface by any user except admin.
Which log will generate an event with the status Unhandled?
An AV log with action=quarantine.
An IPS log with action=pass.
A WebFilter log will action=dropped.
An AppControl log with action=blocked.
In FortiOS 7.4.1 and FortiAnalyzer 7.4.1, the "Unhandled" status in logs typically signifies that the FortiGate encountered a security event but did not take any specific action to block or alter it. This usually occurs in the context of Intrusion Prevention System (IPS) logs.
IPS logs with action=pass: When the IPS engine inspects traffic and determines that it does not match any known attack signatures or violate any configured policies, it assigns the action "pass". Since no action is taken to block or modify this traffic, the status is logged as "Unhandled."
Let's look at why the other options are incorrect:
An AV log with action=quarantine: Antivirus (AV) logs with the action "quarantine" indicate that a file was detected as malicious and moved to quarantine. This is a definitive action, so the status wouldn't be "Unhandled."
A WebFilter log will action=dropped: WebFilter logs with the action "dropped" indicate that web traffic was blocked according to the configured web filtering policies. Again, this is a specific action taken, not an "Unhandled" event.
An AppControl log with action=blocked: Application Control logs with the action "blocked" mean that an application was denied access based on the defined application control rules. This is also a clear action, not "Unhandled."

TESTED 03 May 2026
Copyright © 2014-2026 DumpsTool. All Rights Reserved
