Which of the following distribution methods or models can most effectively represent the actual arrival times of a bus that runs on an hourly schedule?
A data scientist wants to predict a person's travel destination. The options are:
Branson, Missouri, United States
Mount Kilimanjaro, Tanzania
Disneyland Paris, Paris, France
Sydney Opera House, Sydney, Australia
Which of the following models would best fit this use case?
A data scientist has constructed a model that meets the minimum performance requirements specified in the proposal for a prediction project. The data scientist thinks the model's accuracy should be improved, but the proposed deadline is approaching. Which of the following actions should the data scientist take first?
A model's results show increasing explanatory value as additional independent variables are added to the model. Which of the following is the most appropriate statistic?
Which of the following is a classic example of a constrained optimization problem?
A data analyst wants to save a newly analyzed data set to a local storage option. The data set must meet the following requirements:
Be minimal in size
Have the ability to be ingested quickly
Have the associated schema, including data types, stored with it
Which of the following file types is the best to use?
A data scientist would like to model a complex phenomenon using a large data set composed of categorical, discrete, and continuous variables. After completing exploratory data analysis, the data scientist is reasonably certain that no linear relationship exists between the predictors and the target. Although the phenomenon is complex, the data scientist still wants to maintain the highest possible degree of interpretability in the final model. Which of the following algorithms best meets this objective?
A data scientist is performing a linear regression and wants to construct a model that explains the most variation in the data. Which of the following should the data scientist maximize when evaluating the regression performance metrics?
A data analyst wants to generate the most data using tables from a database. Which of the following is the best way to accomplish this objective?
A data scientist has built a model that provides the likelihood of an error occurring in a factory. The historical accuracy of the model is 90%. At a specific factory, the model is reporting a likelihood score of 0.90. Which of the following explains a confidence score of 0.90?
A data scientist needs to analyze a company's chemical businesses and is using the master database of the conglomerate company. Nothing in the data differentiates the data observations for the different businesses. Which of the following is the most efficient way to identify the chemical businesses' observations?
A data analyst is analyzing data and would like to build conceptual associations. Which of the following is the best way to accomplish this task?
A data scientist is deploying a model that needs to be accessed by multiple departments with minimal development effort by the departments. Which of the following APIs would be best for the data scientist to use?
A company created a very popular collectible card set. Collectors attempt to collect the entire set, but the availability of each card varies, because some cards have higher production volumes than others. The set contains a total of 12 cards. The attributes of the cards are shown.
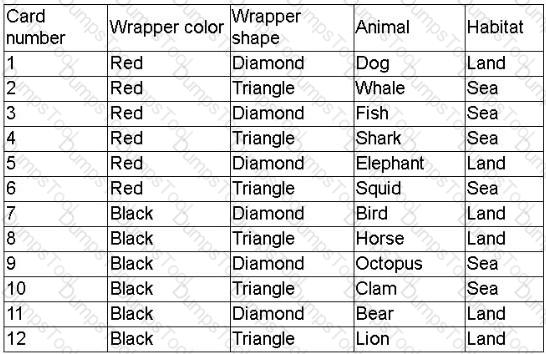
The data scientist is tasked with designing an initial model iteration to predict whether the animal on the card lives in the sea or on land, given the card's features: Wrapper color, Wrapper shape, and Animal.
Which of the following is the best way to accomplish this task?
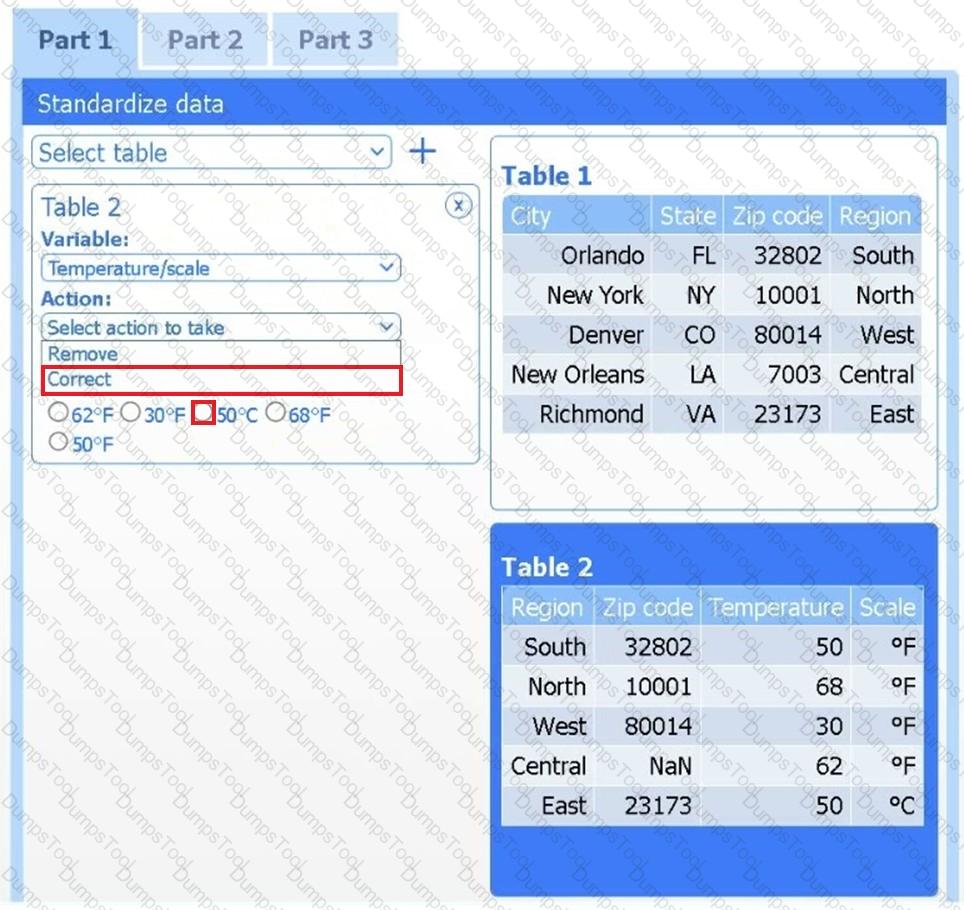
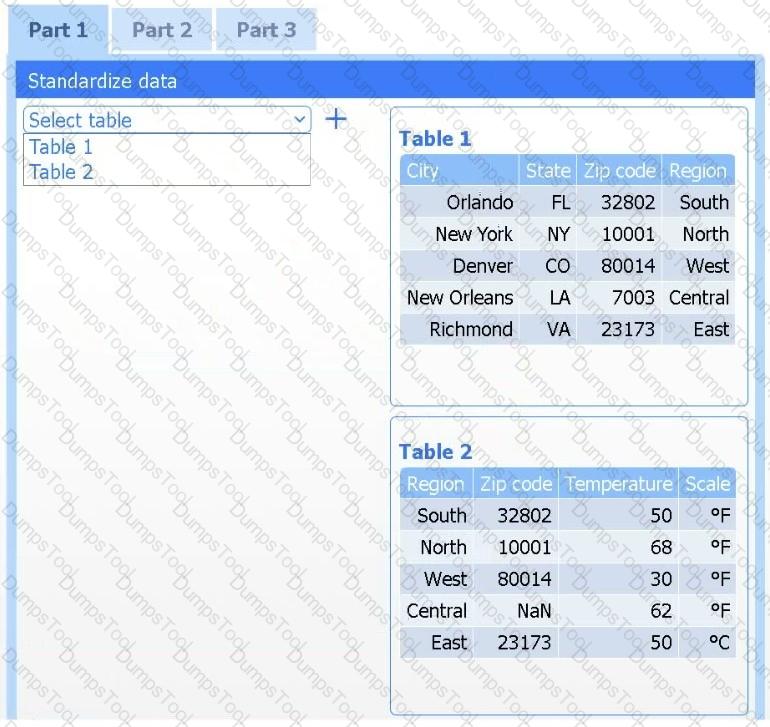
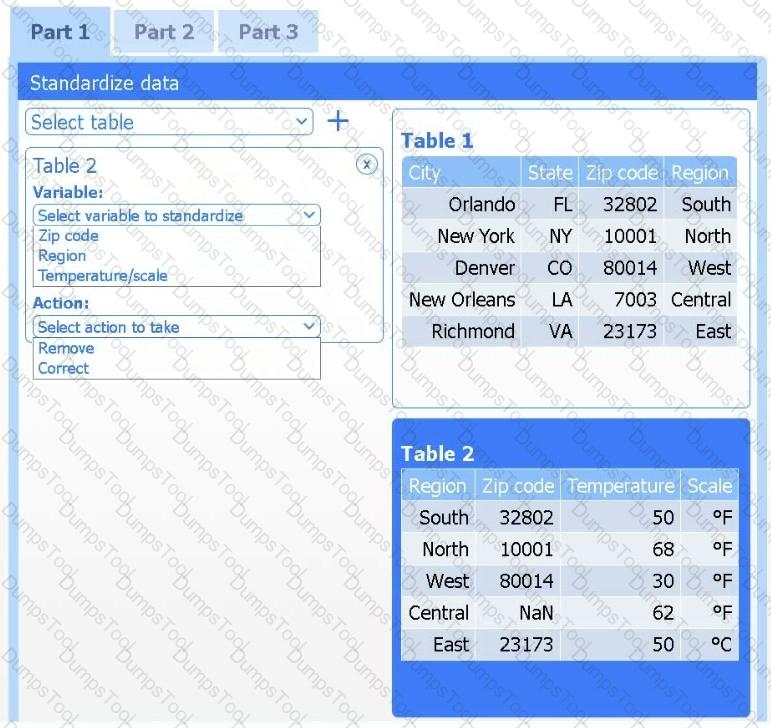
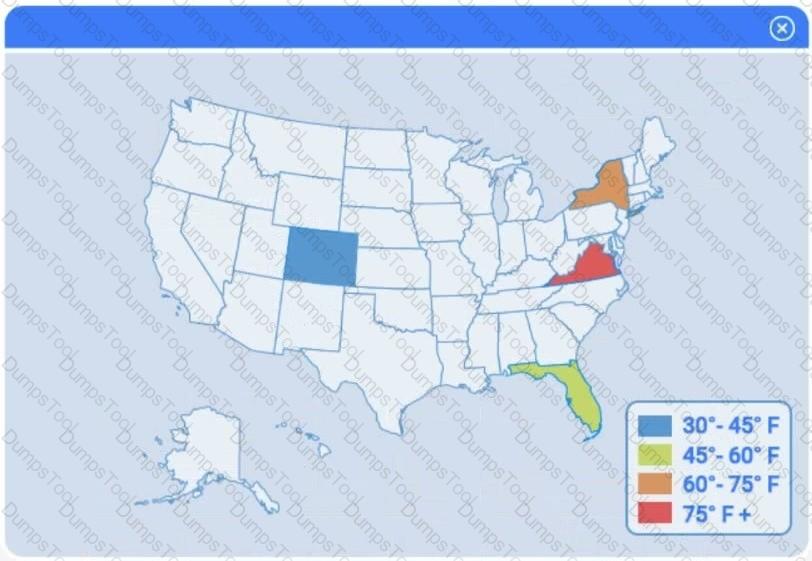
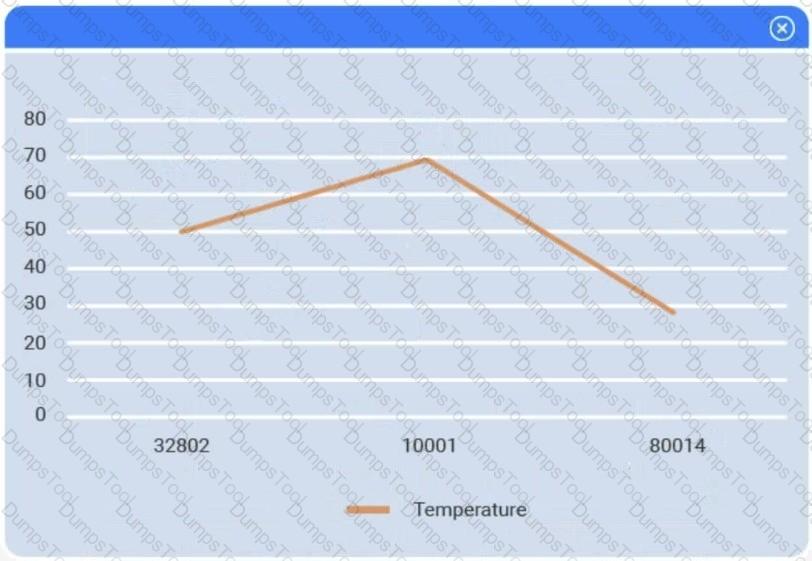
A client has gathered weather data on which regions have high temperatures. The client would like a visualization to gain a better understanding of the data.
INSTRUCTIONS
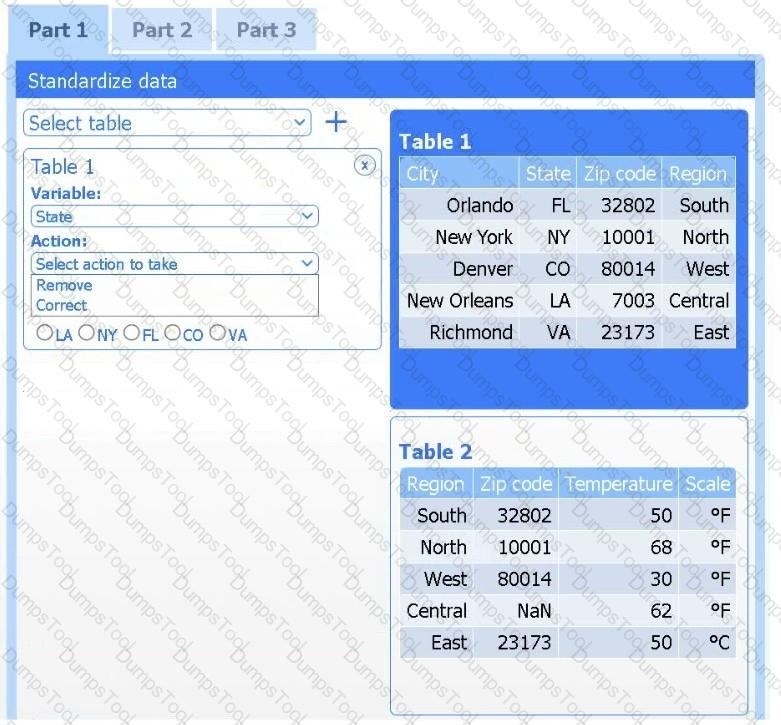
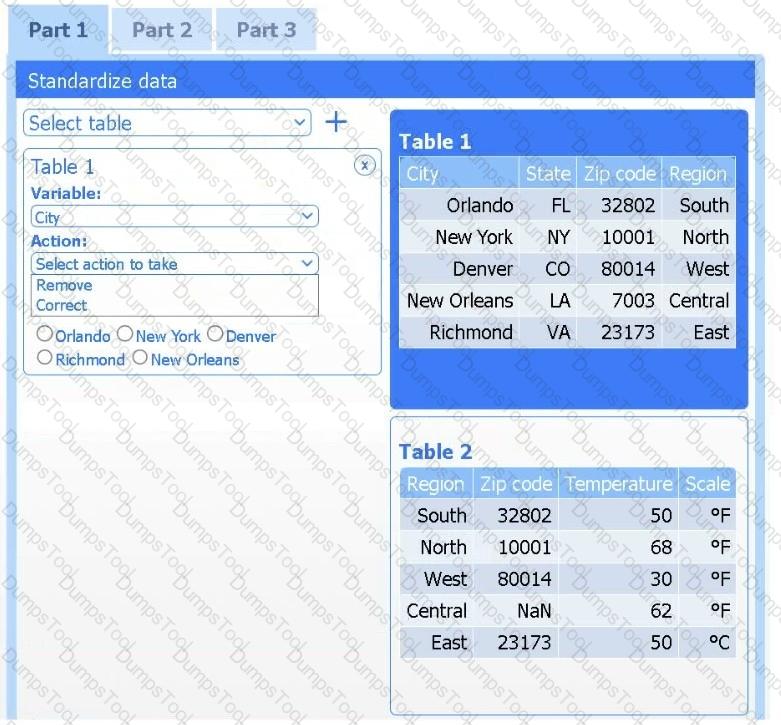
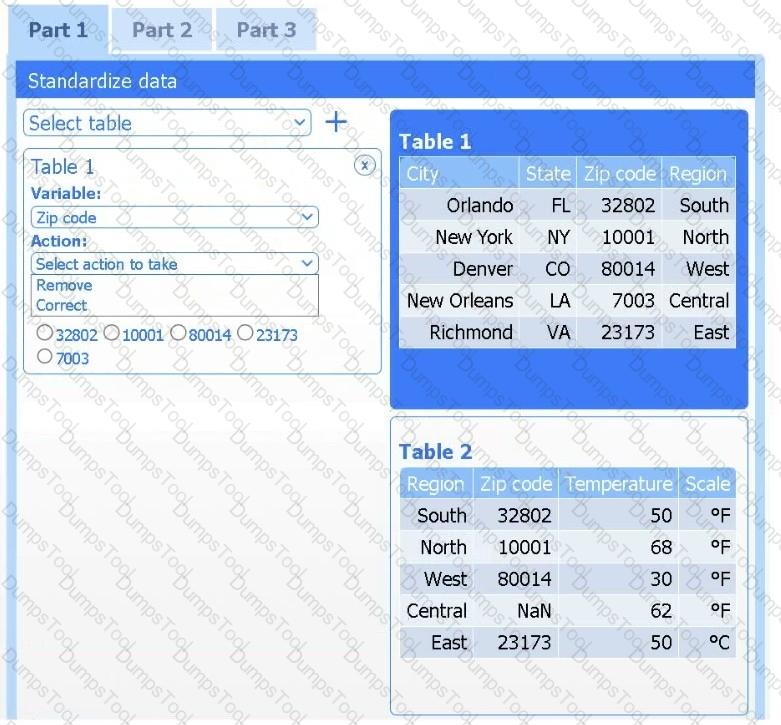
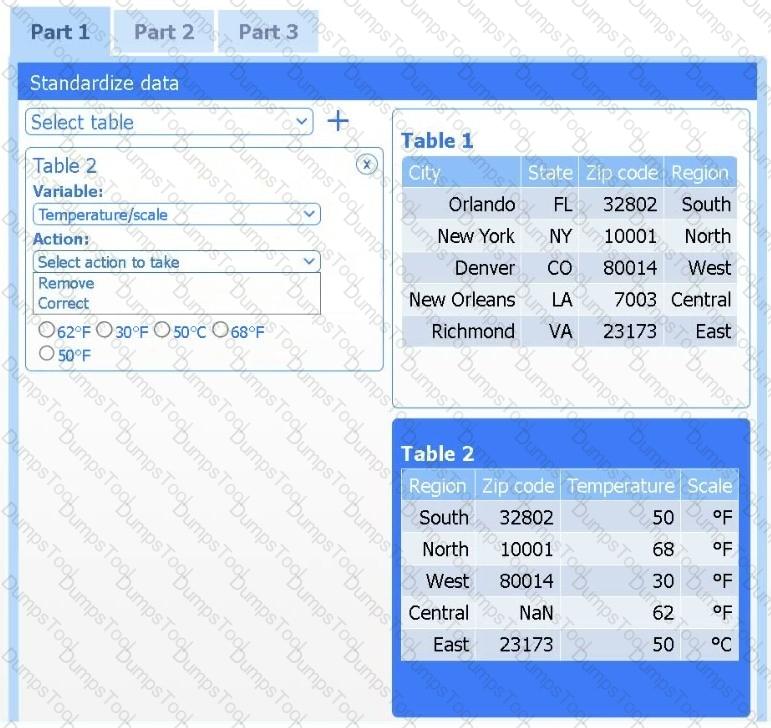
Part 1
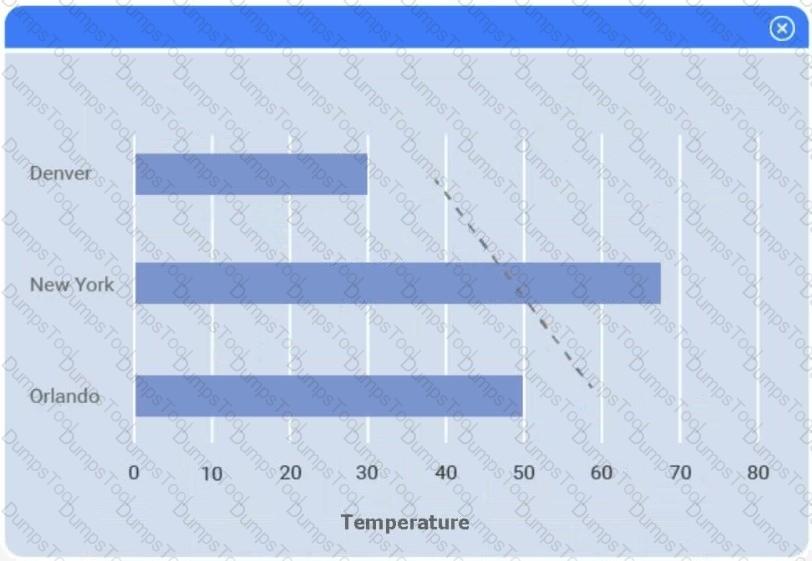
Review the charts provided and use the drop-down menu to select the most appropriate way to standardize the data.
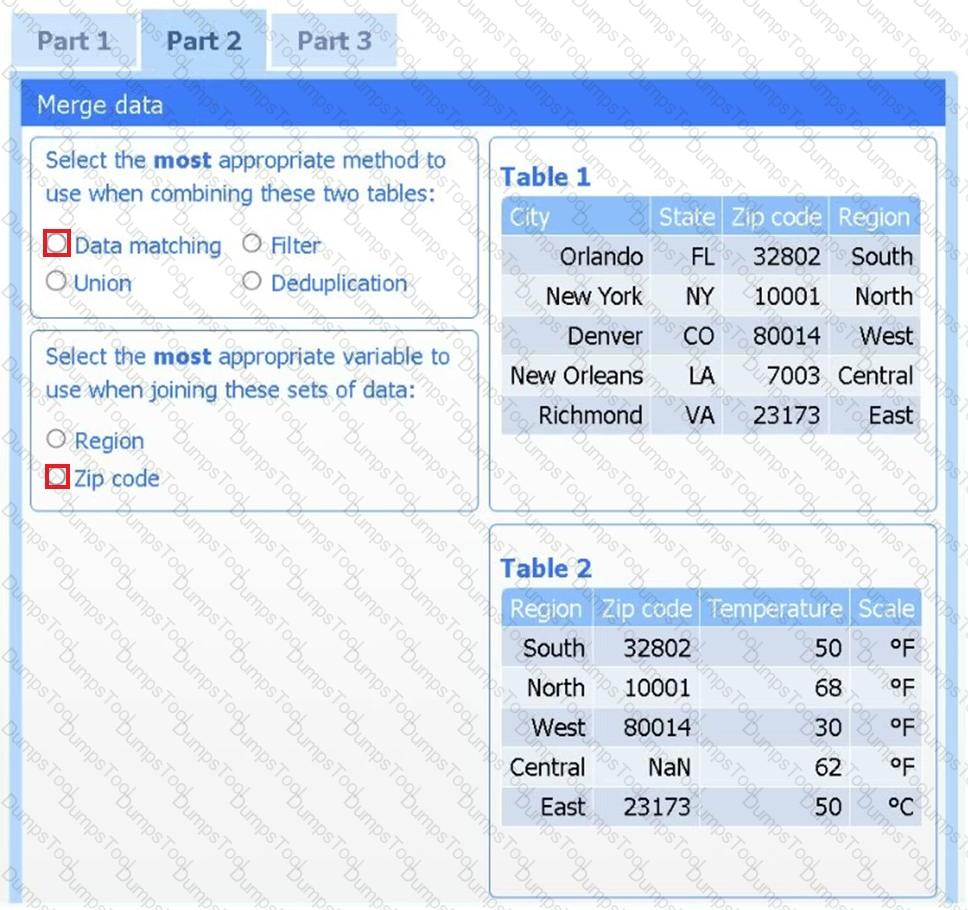
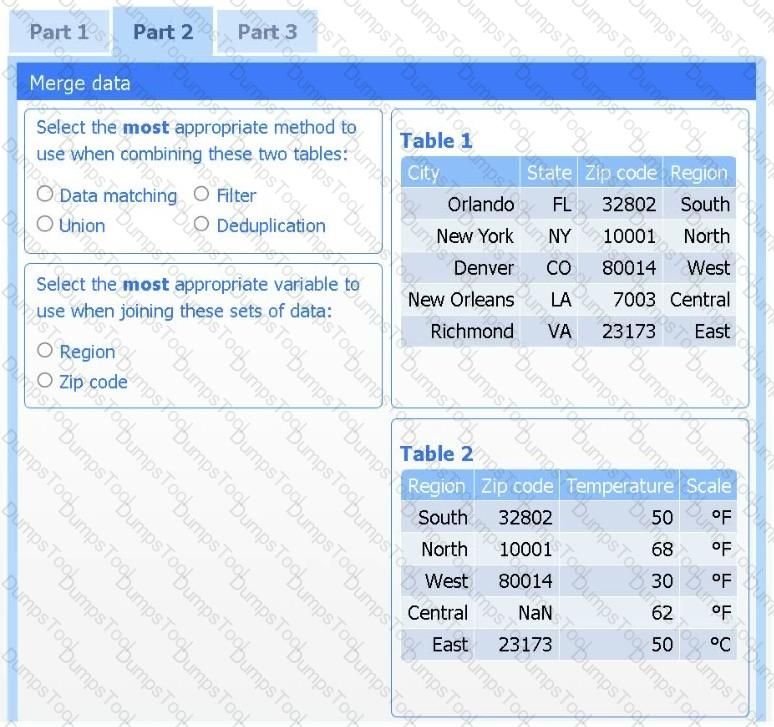
Part 2
Answer the questions to determine how to create one data set.
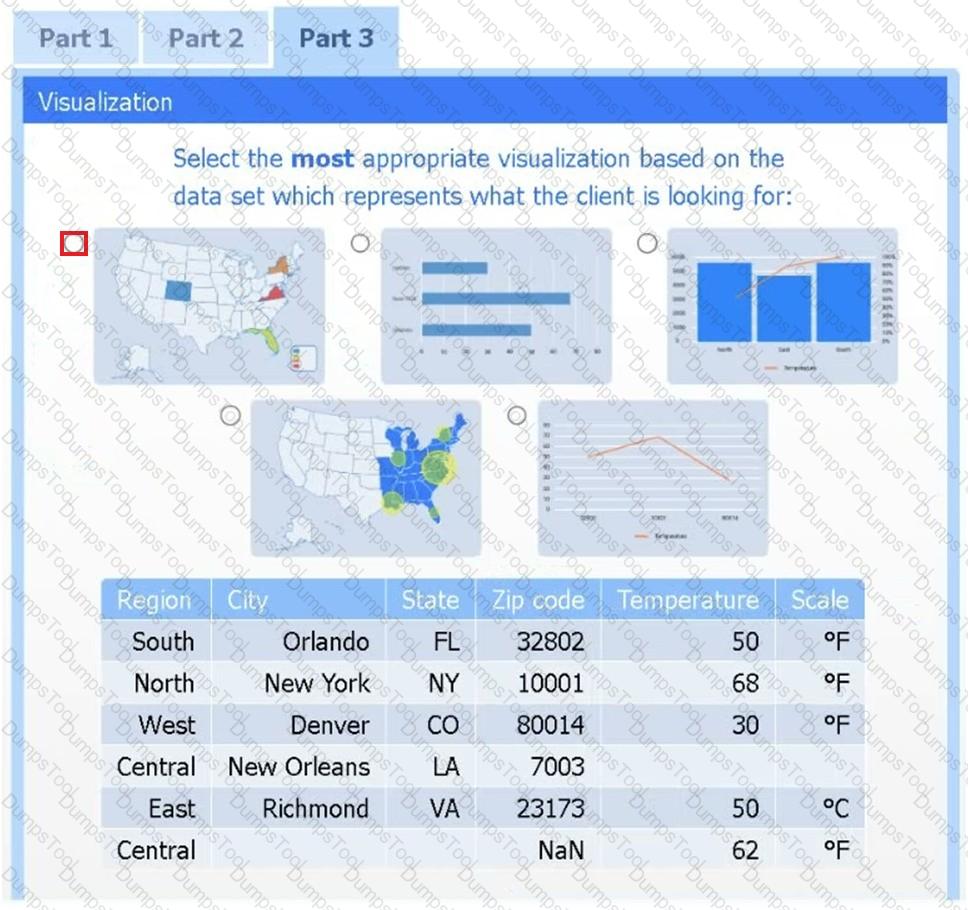
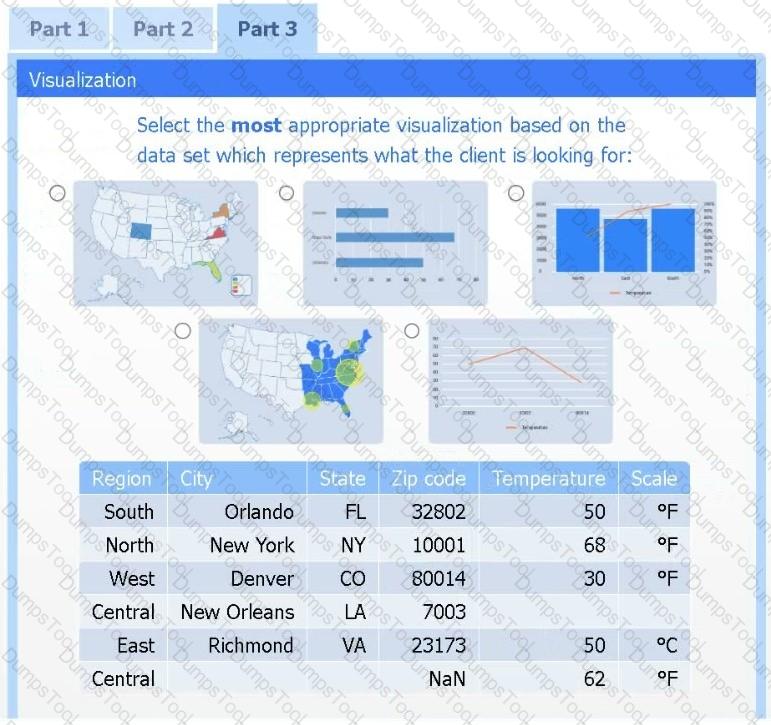
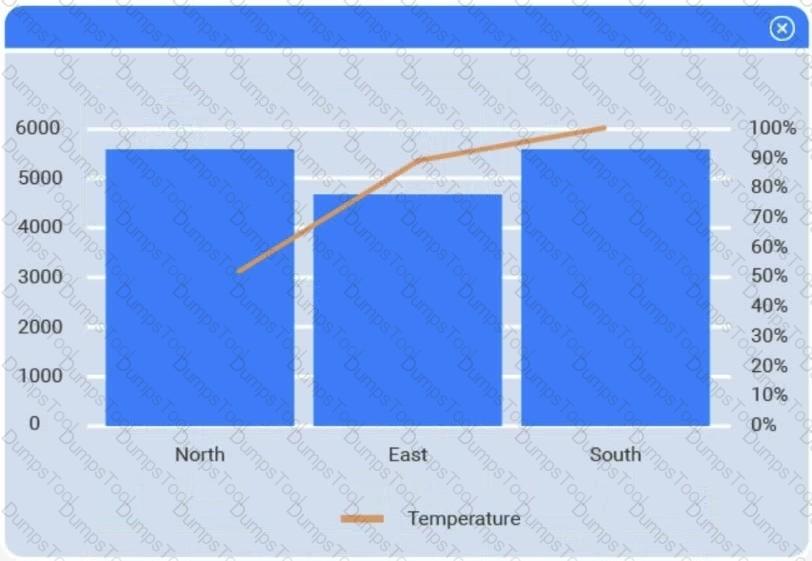
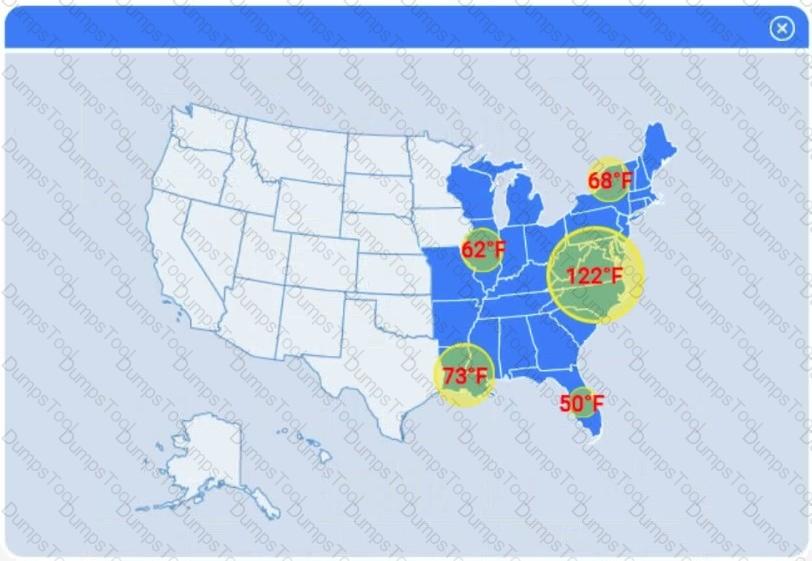
Part 3
Select the most appropriate visualization based on the data set that represents what the client is looking for.
If at any time you would like to bring back the initial state of the simulation, please click the Reset All button.


A data scientist is building an inferential model with a single predictor variable. A scatter plot of the independent variable against the real-number dependent variable shows a strong relationship between them. The predictor variable is normally distributed with very few outliers. Which of the following algorithms is the best fit for this model, given the data scientist wants the model to be easily interpreted?
A data scientist wants to digitize historical hard copies of documents. Which of the following is the best method for this task?

TESTED 18 Jul 2026